| GISdevelopment.net ---> AARS ---> ACRS 1998 ---> Poster Session 1 |
Observed Spatial Variation in
Perceptible Water Vapor by a Ground-Based, Dual-Channel Radiometer
Yuei-An Liou
Center for Space and Remote Sensing Research and Graduate Institute of Space Sciences
National Central University
Chung-Li, Taiwan 320,
yueian@csrsr.neu.edu.tw
Abstract Center for Space and Remote Sensing Research and Graduate Institute of Space Sciences
National Central University
Chung-Li, Taiwan 320,
yueian@csrsr.neu.edu.tw
A ground-based water vapor radiometer (WVR) operating at 23.8 and 31.4 GHz was utilized to observe spatial variation in perceptible water vapor (PWW) at the Taipei weather station on March 18-25, 1998. Through a bilinear regression scheme, PWV were inferred from the observed brightness temperatures of the sky at eleven elevation angles from 15° and the corresponding opacities. In order to derive bilinear regression coefficients, radiosonds soundings collected at the Taipei weather station in marches of 1988-1997 were used. Retrieval errors resulting from these coefficients were computed. We found root mean square error (RMSE) (percentage with respect to mean) between the retrieved PWV and those directly obtained from radiosonde soundings to 0.25 cm (6.5%) if a brightness temperature-based retrieval algorithm is used. The corresponding RMSE is reduced to 0.21 cm (5.2%) if an opacity-based retrieval algorithm is utilized. WVR observations show that PWV varies from 2.4 cm for clear sky to 6.5 cm for rainy/cloudy conditions at zenith and that the atmosphere deviates from a spherically-symmetrical assumption by as much as 8.9% at the angle of 165°. WVR-observed PWV differ from radiosonde observations by 0.51 cm if the brightness temperature-based retrieval scheme is used, and 0.49 cm if the opacity-based retrieval scheme is used. The corresponding retrieved PWV averages are 3.41 and 3.33 cm, respectively.
Introduction
Water vapor plays a crucial role in atmospheric dynamics through its dominant influence on the energy balance of the atmosphere. A knowledge of PWV distribution is therefore important to better initialize and constrain numerical weather prediction (NWP) models. The most typical way to measure PWV is by radiosonde soundings, which suffers from the cost of the devices and their limiting use to certain areas of land. Lidars and Fourier transform infrared spectrometers can profile water vapor, but not beyond cloud (Solheim et al., 1998). White solar spectrometer can be used t estimate PWV (Sierk et al., 1998), the technique can only survive in clear days.
Microwave radiometry represents an alternative way to measure PWV of the atmosphere for all-weather conditions. This radiometric approach relies on the fact that the absorption lines of water vapor locate in the microwave region. For example, a combination of 23.8 and 31.5 GHz near 22.235 GHz of water vapor absorption line can be used to determine PWV (Solheim et al., 1998a; Liou, 1998). In this paper, we present PWV observations by a ground-based radiometric approach from a field campaign conducted at the Taipei weather station from March 18 to 25, 1998.
Radioative Tranfer
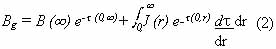
Radioative transfer equation can be described as (Ulaby, et al., 1981)

where, r is the position function, m, t is the optical depth, No, and J is the source function, W/m2-sr. Equation (1) can be explained by the Kirchhoff's law which states that under conditions of local thermodynamic equilibrium, thermal emission must be equal to absorption. For upward-looking radiometry, its solution can be written as
Where,
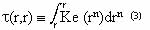
where, ke is te extinction coefficient of the atmosphere. In the microwave region, Equation (2) by the Rayleigh-Jeans law can be rewritten as

Where, Tbg is the brightness temperature observed by radiometer, K, Tbc represents cosmic brightness temperature (2.7), K, an Ta is the temperature of the atmosphere, K.
PWV Retrievals
To derive multiple regression coefficients, 10-years radiosonde soundings collected at the Taipei weather station, Central Weather Bureau (CWB),in Marches of 1988-1997 were used. The use of monthly climatological data is intended to reduce the influence of seasonal variation on PWV inversions. Radioative transfer model developed by NOAA Wave Propagation Laboratory was applied to compute the brightness temperatures at 23.8 and 31.4 GHz (Schroeder and Wastewater, 1991). The model extrapolates the profiles of water vapor, temperature, and pressure to 0.1 mb while computing atmospheric emission, which is dominated by three key constituents of the atmosphere, namely water vapor, liquid water, and oxygen. The amount of cloud liquid water is derived with an adiabatic assumption when relative humidity is higher than 98% (Liou, 1998). It is found that for the 10-year period the average (standard deviation) is 3.79 cm (0.856 cm) for PWV.
In general, absorption dominates over scattering in the lower portion of the microwave so that the letter can be ignored. Hence, the extinction coefficient in Equations (2) and (4) can be replaced by the absorption coefficient. Since water vapor is of a key parameter to determine the absorption characteristics of the atmosphere, it can be determined by the radiometric observations of the atmosphere. That is
where,
- C, are multiple regression coefficients, where the subscript i represents PWV0, PWV1, PWV2, CLW0, CLW1, and CWL2
- Tb, are observed brightness temperatures of the atmosphere, K, where
the subscript i= 1 or 2 represents 23.8, and 31.4 GHz, respectively.
For self-consistency, the regression coefficients obtained from the 10-year radiosonde data are used to derive PWV from brightness temperatures at the two frequencies of interest. The retrieved PWV are compared with those derived from radiosonde soundings. We found that the RMSE (percentage with respect to mean) between the retrieved PWV and those derived from radiosonde soundings is 0.25 cm (6.5%). The corresponding RMSE is reduced to 0.21 cm (5.2%) if the opacity-based retrieval scheme is used.
A ground-based water vapor radiometer (WVR) operating at 23.8 and 31.4 GHz was utilized to observe spatial variations in PWV at the Taipei weather station on March 18-25, 1998. The WVR was loaned by Radiometries Corporation, USA. During the field campaign, the WVR was initially installed due east, while it was turned to due north periodically. A directions perpendicular to the WVR itself so that atmospheric emissions can be measured at eleven elevation angles from 15° to 165° at an interval at 15°.
Figure1 shows (a) brightness temperatures and (b) opacities at 23.8 and 31.4 GHz, and (c) the corresponding PWV derived from radiosonde data collected at Taipei weather station in Marches of 1988-1997. In general, brightness temperature and opacities are increased with increasing PWV. High value of brightness temperature and opacity are associated with the presence of cloud liquid water and precipitation. Otherwise, brightness temperatures at both frequencies are generally lower than 100 K, and the corresponding opacities are lower than 0.5.
Figure 2 compares (a) brightness temperatures at 23.8 and 31.4 GHz, and (b) PWV derived from both WVR and radiosonde soundings collected on March 18-25, 1998. WVR-observed brightness temperatures are generally lower than those derived from radiosonde soundings. Standard deviations in differences between them are 14.2 K for 23.8 GHz and 27.3 K for 31.4 GHz. The corresponding standard deviations for the PWV are 0.51 and 0.49 cm for the brightness temperature- and opacity-based retrieval algorithms, respectively . Major differences between WVR and radiosonde observations of brightness temperatures and PWV appear in the mornings of March 23 and 25 (day numbers of 82 and 84) probably because measurements from radiosondes and WVR lack of spatial and temporal consistency.
Since the opacity-based retrieval algorithm provides better estimates of PWV than the brightness temperature-based approach in the self-consistent test, the opacity-based scheme is used to derive PWV in the rest of the paper. Figure 3 shows WVR-observed PWV for elevation angles from 15° to 165° on March 18-25, 1998 when the WVR is due east. As expected, higher values of PWV appear at angles further departing from the zenith. Minimum PWV at a given time in general occurs at zenith as expected. Noise-like signals can be seen from day numbers 79 to 81 (March 20 to 22) so that the observed PWV from midnight to noon from day numbers 79 to 81 (March 20 to 22) so that the observed PWV from midnight to noon of March 20 are shown in Figure 4 for better visualization. Figure 4 indicates that there was a northward weather system in the line of sight of the WVR between 6 to 8 a.m.
Figure 5 shows the difference in PWV between WVR observations and those derived through a secant mapping of the angle between the observing angle and eh zenith (cosecant of the observing angle) with respect to the PWV at zenith on March 18-25, 1998. There are 345 observations for each of the eleven elevation angles. The atmosphere deviates from spherically-symmetrical assumption by 8.9% at angle of 165°. The average PWV at angle of 165° is 14.2 cm.
To examine the differences between PWV observations when the WVR is due north and those when the WVR is due east, the observed PWV at the two situations are compared with. The differences between them for the eleven corresponding pairs of angles range from 0.28 cm at zenith to 0.55 cm at 15° as listed in Table 1. The discrepancies in PWV for the zenith pair are primarily due to temporal inconsistency. This indicates that PWV significantly varies with time since each pair of data were taken at an interval of 10 minutes of so.
| Angle degree | 15 | 30 | 45 | 60 | 75 | 90 | 105 | 120 | 135 | 150 | 165 |
| Difference, cm | 0.66 | 0.29 | 0.29 | 0.31 | 0.32 | 0.28 | 0.32 | 0.34 | 0.29 | 0.38 | 0.54 |
| Difference/mean,% | 4.8 | 4.1 | 6.1 | 8.0 | 9.2 | 8.2 | 9.40 | 8.8 | 6.6 | 5.5 | 3.8 |
Conclusions
Brightness temperature- and opacity-based retrieval algorithms were developed to infer PWV from ground-based WVR observations. They reproduced PWV with accuracy of 93.5%, and 94.8% respectively. Based upon the opacity retrieval approach, WVR observations collected at CWB's Taipei weather station on March 18-25, 1998 show that the atmosphere deviates from a spherically-symmetrical assumption by as much as 8.9% at angle of 165°. In addition, PWV changes rapidly with time on the order of 0.28 cm (8.2%) per 10 minutes.
Acknowledgments
The author appreciates much the National Space Program Office grant NSC87-NSPO(A)-PC-FA07-05. The author also thanks Dr. F. Solheim, Radiometrics Corporation for the WVR used in our experiment.
Reference
- Liou, Yuei-An, 1998b, "Ground-based radiometric sensing of atmospheric in homogeneity in precipitable water vapor, "Atmospheric Sciences, 1998. (revised)
- Schroeder, J. A., and E. R. Westwater, 1991: Users' guide to WPL microwave radioative transfer software. NOAA Technical Memorandum ERL WPL-213, 84 pp.
- Sierk, B., Burki, H. Beckner-Ross, S. Florek, R. Neubert, L. P. Kruse, and H. Kahle, 1998: Tropospheric water vapor derived from solar spectrometer, radiometer, and GPS measurements. J. Geophys. Res. (in press)
- Solheim, F., J. R. Godwin, E. R. Westwater, Y. Han, S. J. Keihm, K. Marsh, and R. Ware, 1998: Radiometric profiling of temperature, water vapor and cloud liquid water using various inversion methods. Radio Sci., 33, 393-404.
- Ulaby, F. T, R. K. Moore, and A. K. Fung, 1981: Microwave Remote Sensing: Active and Passive, Vol. I, Artech House Inc, Norwood.


Figure 1: (a) Brightness temperatures (Tb), and (b) opacities (Tau) at 23.8 and 31.4 GHz, and (c) precipitable water vapor (PWV) estimated from radiosonde soundings observed at CWB's Taipei weather station for March of 1988-1997.

Figure 2: WVR-observed (a) brightness temperatures at 23.8 and 31.4 GHz, and (b) PWV by the Tau-based retrieval scheme at zenith versus their corresponding radiosonde observations at the CWB's Taipei weather station on March 18-25, 1998.
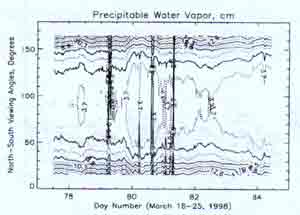
Figure 3: WVR PWV at all angles derived by the Tau-based retrieval scheme on March 18-25, 1998.
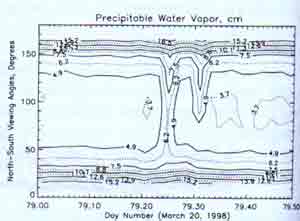
Figure 4: WVR PWV at all angles derived by the Tau-based retrieval scheme on March 20, 1998.
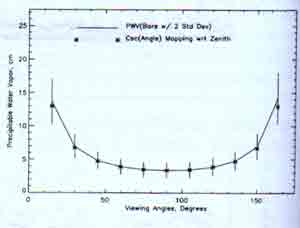
Figure 5: Difference in PWV between WVR observations and those derived through a secant mapping of the angle between the observing angle and the zenith (cosecant of the observing angle) with respect to the PWV at zenith on March 18-25, 1998.