| GISdevelopment.net ---> AARS ---> ACRS 1998 ---> Poster Session 1 |
Investigation of
High-Latitude Tracer Characteristics by using Ilas and other Satellite
Data
Wookap Choi and Sumi
Kim
Department of Atmospheric Sciences
Seoul National University
Seoul, 151-742,Korea
1.
Introduction Department of Atmospheric Sciences
Seoul National University
Seoul, 151-742,Korea
Observing the chemical species in the stratosphere is crucial for understanding the procedures determining the distribution and change of the ozone layer. The Upper Atmosphere Research Satellite (UARS) was launched in 1991 and observations by the instruments on the satellite have been contributing much to our knowledge about the stratosphere.The spatial coverage of observation by the UARS, however, is limited to the low-to-middle latitudes. In this point of view the Improved Limb Atmosphere Spectrometer (ILAS) aboard the satellite ADEOS (Advanced Earth Satellite Observation), which was launched on August 1996, is complementary to those instruments on the UARS since the ILAS observed the stratosphere in the high latitude region (Sasano et al., 1995). The Halogen Occulation Experiment (HALOE) is one of the instrument aboard the UARS and both ILAS and HALOE use the solar occultation technique. TO investigate transport of chemical tracers, we need to know distribution across the wide latitudinal ranges. The instrument ILAS and HALOE thus are useful to investigate the temporal change of tracer distributions.
In this study distribution of ozone and methane in the stratosphere from November 1997 to June 1998 were investigated by analyzing the ILAS (Version 3.1) and HALOE data (Version 18). The ILAS observes the high latitude region while the HALOE observes mainly low to middle latitudes. These observations were irregular in time and space. They were then interpolated in time and space to produce distribution on the regular grid points. The characteristic features appeared in the high latitudes are discussed.
2. Intercomparison of ILAS and HALOE vertical profiles Among the chemical species observed by the ILAS we concentrated on methane and ozone distributions which are also observed by the HALOE. The ILAS data were available now in version 3.1 for 8 months from November 1996. The latitudes of observation by ILAS is shown in Fig. 1. The high - latitude coverage by ILAS is excellent. The HALOE data are now supplied in version 18 and the levels of accuracy are seemed to be high.At one point the vertical profiles from the ILAS and the HALOE are compared which are shown in Fig 2. The latitude (near 690S) and the longitude (near 1470E) of observation on the 20th of November are close enough for intercomparison. The vertical profiles of both tracers by both instruments are in good agreement although the ILAS shows smaller ozone mixing ratio than HALOE.
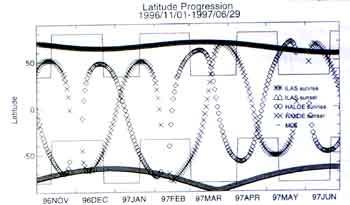
Fig. 1 Latitudes of observation by ILAS and Haloe for both sunset and sunrise observations. The latitudinal range of observation by MLS is also shown.
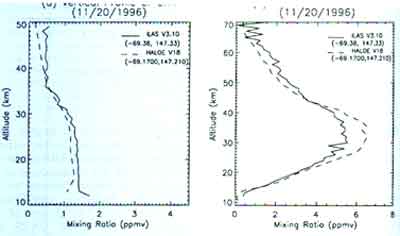
Fig. 2 Vertical profiles of mixing ratios of (a) methane and (b) ozone from ILAS and HALOE.
Further intercomparison between two instrument are found in Lee et al. (1998). The ozone profile by ILAS was also compared to that of Microwave Limb Sounder (MLS) which is another instrument aboard UARS (Fig. 3). The shape of MLS is usually smoother than that of ILAS or HALOE. The profiles are similar in many respects.
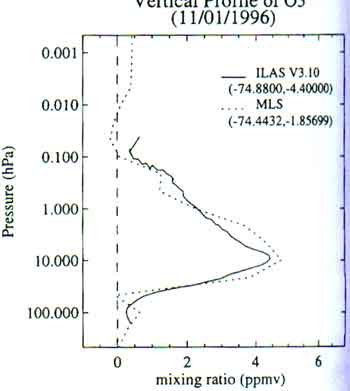
Fig. 3 Vertical profiles of mixing ratios of ozone from ILAS and MLS.
(a) HALOE O3 Mixing Ratio (ppmv) (02/19/1997-03/23/1997)
(b) HALOE & ILAS 03 Mixing Ratio (ppmv) (02/19/1997-03/23/1997)
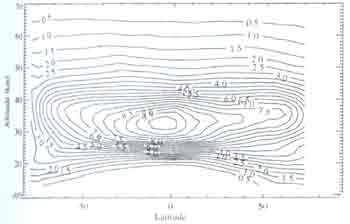
Fig. 4 Mixing ratio of ozone from (a) HALOE and (b) both ILAS and HALOE
The latitude coverage is revealed clearly in Figs. 3 and 4 which are latitude-altitude cross-sections. The upper panels show only HALOE data and bottom panels both HALOE and ILAS. The time of observation is not identical and dependent on the latitude as shown in Fig. 1. Although the latitude coverage by ILAS is not extensive its usefulness is clear. Especially for methane the Antarctic maxima below 30 km level is not anticipated from HALOE observation(Fig. 4a).Also the number of HALOE observation is too small to verify a certain pattern of distribution poleward of 50 degrees.
3. Interpolation using ILAS and HALOE data
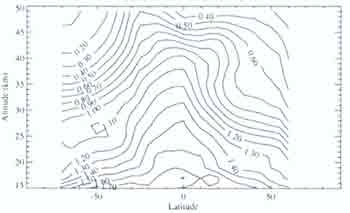
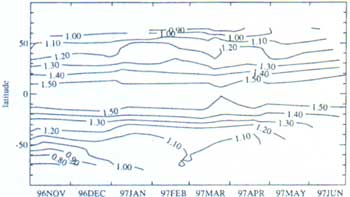
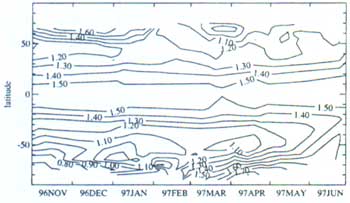
The spatial coverage of observation by ILAS and HALOE is not synoptic as shown in Fig. 1 since the observation technique is solar occultation. The distribution on regular grid is more useful. To make regular data, the HALOE data are averaged zonally and obtained on the isentropic surfaces. For each isentropic surface time-latitude cross-section wwere produced on the regular grids by temporal-spatial interpolation .An example of the time-latitude section on an isentropic surface is shown in Fig.6a. The ILAS data is also a synoptic due to the observation method. Addition of ILAS data in high latitudes on each isentropic surface yields the same section with wider latitudinal range as shown in Fig. 6b.Moreover, the pattern of change is clearer and more convincing. The data quality was improved after using the data from both ILAS and HALOE than before using the ILAS data alone. In the summer hemisphere rising motion is observed at 60 degree latitude in the southern hemisphere while sinking is observed in the northern hemisphere by the HALOE data. No models have shown rising motion in the polar region in the summer hemisphere. Although the HALOE observations are not frequent at those latitude, the ILAS provides much more observations in the summer polar region. Using both data sets thus increase understanding polar circulation patterns.
(a) HALOE ch4 Mixing Ratio(ppmv)(02/19/199 (02/19/1997-03/23/1997)
(b) HALOE & ILAS ch4 Mixing Ratio (ppmv) (02/19/1997-03/23/1997)
Fig. 5.Same as in Fig. 4 but for methane.
(a) HALOE CH4 Mixing Ratio(ppmv) on the 600K isentropic surface
(b) ILAS &HALOE CH4 Mixing Ratio(ppmv) on the 600K isentropic surface
Fig. 6. Time-latitude sections of methane on 600 K isentropic surface from (a) HALOE and (b) both ILAS and HALOE data.
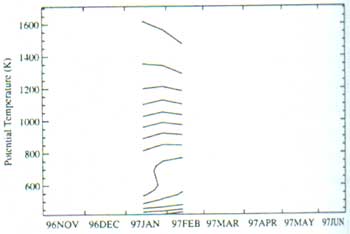
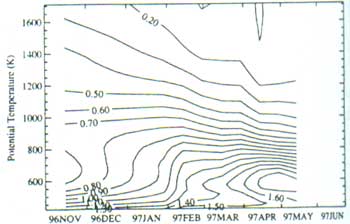
The summer polar rising motion is even clearer in time-altitude section at specified latitude. Figure 7 shows interpolated those sections at 75 degree in the southern hemisphere. By using HALOE only it is not possible to see the temporal change of the distribution. Figure 7b shows the rising motion in the lower stratosphere clearly. Without addition of HALOE data constructing time series is difficult.
(a) HALOE CH4 Mixing Ratio (ppmv) latitude:75S
(b) ILAS & HALOE CH4 Mixing Ratio(ppmv) latitude:75S
Fig. 7. Time-altitude sections of methane mixing ratio at 750S from (a) HALOE and (b) both ILAS and HALOE.
4. Tracer distribution following the latitude circle
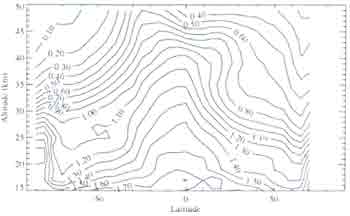
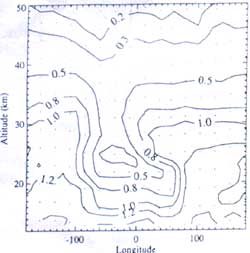
The distribution of quasiconservative tracers following the latitude circles which is another useful information for transport. In Fig. 8 the wave pattern is clear in the southern hemisphere spring. The pattern is roughly wave number one type. Figs.8a and 8b are constructed by both ILAS and HALOE data at the same time at different latitudes. By observing the different latitudes.By observing the different latitudes simultaneously the spatial patterns of the planetary wave were revealed. Near the 25 km level, the minimum value is about 0.2 ppm at 620S while it is about 0.5 ppm at 700S. The maxima at both latitudes are similar. The wavenumber one pattern is changed to no wave pattern by the early April (Fig. 9). Presumably at this time, the winter polar vortex pattern is already dominant. Figure 9 also reveals the strong vertical gradient along with the strong zonal circulation both of which are signs of winter circulation pattern.
(a) HALOE CH4 Mixing Ratio (ppmv) on 11/16/1996 at 62.0600S-63.8800S
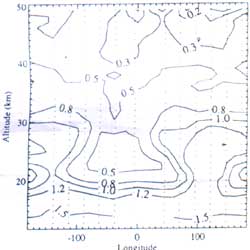
(b) ILAS CH4 Mixing Ratio (ppmv) on 11/16/1996 at 70.3100S-70.5600S
Fig. 8 Longitude-altitude sections of methane ratio from (a) HALOE and (b) ILAS data.
Whether the planetary wave is present (Fig.8a) or absent (Fig. 8) is an important factor determining transport. In Fig. 10, there is another example of the planetary wave, this time wave number two pattern. To estimate transport by the eddy flux the meridional wind component from the UKMO data (Fig. 10b) was utilized. The meridional wind pattern is close to wave number one type. The amount of the eddy flux shown in Fig. 10c is significant, especially in the lower stratosphere. Another calculation done for early March (not shown) shows virtually no eddy flux.
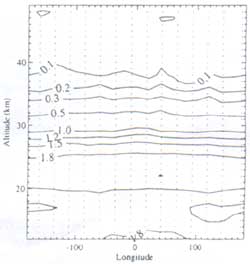
Fig. 9. Same as in Fig. 8a but for different time and latitude.
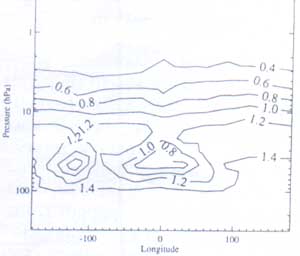
(a) ILAS CH4 mixing ratio on 12/13/1996at65S
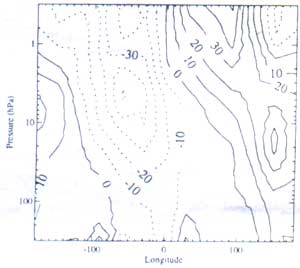
(b)UKMO meridional wind (m/s) on 12/13/1996at 66.2500S
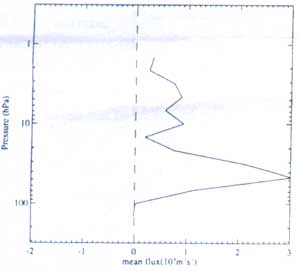
(c) ILAS CH4 mean flux on 12/13/1996 at 65S
Fig. 10. Longitude-altitude sections of (a) ILAS methane, (b) UKMO meridional wind and (c) meridional eddy flux of methane.
5. Summary and discussion
In this study distribution of ozone and methane in the stratosphere for 8 months were investigated by analyzing the ILAS and HALOE data. The ILAS observes the high latitude region while the HALOE observes mainly low to middle latitudes. Thus observation from both instruments are complementary in terms of the latitude coverage. Combination of both data sets are not always easy. The mixing ratio values are somewhat different. For combination of both satellite data sets, the additional data from the MLS on the UARS is used for certain instances. Although combination is not easy it would be useful to investigate global transport associated large scale circulation such as quasi-biennial oscillation (Choi et al., 1998). Eddy flux yields valuable information about transport due to the planetary wave motion. Calculated eddy flux can be utilized to obtain the eddy mixing coefficients and will be compared with those obtained through other methods. Eddy mixing coefficients are essential information in the zonally averaged models.
Acknowledgement
The authors thank the ILAS and HALOE project teams for providing the ILAS and HALOE data respectively, and Mijeong Park for assistance in HALOE data analysis. This research was supported by the NASDA and ESCAP.
References
- Choi, W., W.B.Grant,J.H. Park, K.M. Lee,H.Lee,and J.M.Russell III,1997: Role of the quasi-biennial oscillstion in the transport of aerosols from the tropical stratospheric reservoir to midlatitudes, fields in the equatorial stratosphere. J.Geophys. Res., 103, 6033-6042.
- Lee, K.-M., J.M. McInerney,Y.Sasano, J.H. Park, W. Choi, and J.M. Russell III, 1998: Initial intercomparison of ILAS and HALOE ozone at high latitudes in springtime. Submitted to the Geophys.Res. Lett.
- Sasano, Y., M.Suzuki, T.Yokota, and H.Kanzawa, 1995: Improved Limb Atmospheric Spectrometer (ILAS) project: ILAS instrument, performance and validation plan. SPIE,2583, 193-204.