| GISdevelopment.net ---> AARS ---> ACRS 1998 ---> Poster Session 1 |
Recognition of Flooded Area
in Radar Image using Texture Feature Analysis
Yang Xiaomei Zhou Chenghu
State Key Laboratory of Resources & Environment information System (LREIS),
Institute of Geography, Chinese Academy of Science, Beijing, 100101, China
Abstract State Key Laboratory of Resources & Environment information System (LREIS),
Institute of Geography, Chinese Academy of Science, Beijing, 100101, China
Radar image data find special application in the flood monitoring due to the properties of all-weather and day-and-nigh and capability of cloud-piercing. But the classification and object extraction of radar image are very difficult because its imaging mechanism is quite different from multispectral image. This letter present a comprehensive methodology, based on the texture analysis, for flooded area identification from the SAR images. The case study in poyang Lake floods in 1998 showed the effectiveness and efficiency of the developed method. The analysis result were timely provided to the central and local governments to help them to make decision for flood disaster reduction.
1 Introduction
As a country governed by monsoon climate, China is subjected to repeated flood disaster. The history of flood control can trace back to about 3000 BC or early (Zhou 1993). Nowadays, more and more advanced technology, such as remote sensing, geographic information system, GPS, are combined with traditional measures for food prevention and disaster reduction. Flood monitoring and damage evaluation using remote sensing technique of satellite and airborne surveying has been listed as one of the national key projects since 1980 in China.
Remotely sensed data have been intensively used to monitor flooding and assess its damage in last decades. NOAA AVHRR data are successfully used to monitor the flood process by taking advantage of its high temporal resolution, and Landsat MSS and TM to estimate the land use type in inundated area by its high spatial resolution and multiple bands (Wilson 1997). However the visible and infrared remote sensors do not work effectively during the flood seasons due to the cloud weather. Microwave sensor has the property data for floods monitoring as more and more SAR satellites were successfully launched and operate well.
This letter was devoted to the development of a method based on the texture feature for extracting flooded are from satellite SAR image. The analysis of the flood regime in Poyang Lake basin in the summer of 1998 was conducted and outputs have been used by China central and local governments in the emergency response to the flooding such as the organization of the victim evacuation in the inundated area.
2 Methodology
2.1 Study site and data used
As the largest fresh water lake in China, Poyang lake Lake accepts the water from five rivers in its upper basin, and swallow and spit the water in Yangtz River, being a natural flood diversion for Yangtz River floods. This summer, the disastrous flooding happened in the whole Lake basin. The water level in the Lake was higher than the historic record. Identifying the scope of the inundation and evaluating the flood regime is urgent.
In response to this flooding, two image data sets covering Poyang Lake region were used. One is SAR image data obtained by ERS -2 satellite at 10:52 on July 7, 1998, the right time of flooding. The other is 7-band landsat TM image, prior to the flooding, which reflects the normal situation of the Lake.
2.2 Radar image smoothing
The presence of speckle in SAR imagery reduces the ability to resolve fine details within the image. Excessive speckle can result in an uninterpretable image, so we have to trade resolution for speckle reduction by using a certain filter. Enhanced lee filter is selected to reduce the speckle effect by comparison of the filtered images from Lee filter, enhanced Lee filter frost filter, enhanced Frost filter, Kuan filter and Gramme Map filter, on the conditions that a good filter should maintain edges and texture in origin image and filtered image should be more contrast, compared to the original image.
In addition, larger kernel window is sutiable for homogeneity analysis. Different kernel window from 3*13 are also experimented, 11*11 kernel for uniformity and 5*5 kernel for statistic analysis are best selected for texture analysis of water bodies on ERS images.
2.3 Texture features
Radar imaging has its own specific characteristics that are quite different from optical and infrared remote sensing. Radar image depends heavily on the scatter of ground objects and its textures sharply vary with different objects. For example cultivated land and forest (sun and Wee 1982. Laws 1985, Arai 1991, Lee and Philpot 1991), ice discrimination (Barder et al. 1991, sun Y. et al. 199). The technology of automatic recognition of waters from radar image is the key to timely monitoring floods.
In a SAR image, a calm water surface always causes mirror reflection, no echo signal will be found, while wave on water surface may cause variations of tone in form of light alternating with shade. Tone also changes from low to high values from the let side to right side of the whole image because of the effect of imaging angle. We cannot select proper threshold value to segment water bodies, just based on the pixel gray levels.
The co-occurrence matrix, based on second-order statistics, is usually used to depict the spatial relationship among the pairs of gray values of pixels. And 14 texture features could be computed from he co-occurrence matrices (haralick 1979, Conners and Harlow 1980). By comprehensive analysis and comparison of the 14 texture feature, it is founded that uniformity of energy which is a measure of image homogeneity, variable which reflects a image heterogeneity, entropy which describes the image complexity, are more suitable to identifying the inundated area.
The larger the window, the more accurate the estimation of local information, however a large window implies more averaging over different texture properties. As a consequence, the segmentation windows have a lower accuracy in locating the boundaries. The means optimizing the window size will be necessary. In this study, 15*15 windows are used to derive the texture values for the water detection.
3 Results
3.1 Extraction of Flooded Area
The basic method for water detection is thresholding. A number of threshold levels can be defined to separate various ranges of texture value. In this research the segmentation was performed on the basic of the characteristics of the double peak in the histogram of texture images as shown in figure 1. We choose the value located at trough point as the threshold. Figure 2a,b,c respectively represent the flooded area from the above texture images. It was easily found in the result images that the areas shadowed by mountain were mistakenly detected as flooded area. By using the DEM these areas can be automatically detected from the derived images.
Compared with the ground truth , an image interpreted visually from SAR data (shown as the contour line of water bodies), We can find that the main errors distribute in ramification. Of which the result of the extracted water segments using homogeneity feature was best, the pixel number was 86990 version 74811, the accuracy was about 86%. The method of entropy features was better the accuracy was 80%. The other accuracy which extracted water variable feature was 72%.
3.2 land Use Statistics in flooded Area
Overlying the map of country's boundary with the land use map interpreted from landsat TM and the flooded area image, flooded land use was calculated and tabled in the following table. In this flood, the most affected was the paddy field, second grass land (shown as figure 3).
| Country Name | paddy | Non-irrigated | forest | grass | gloodplain |
| Huangei | 3379.460 | 195.860 | 3.600 | 16.890 | 1180.200 |
| Jiujiang | 657.960 | 1230.340 | 32.760 | 727.630 | 843.456 |
| Pengze | 19.701 | 108.007 | 33.346 | 3.960 | 78.750 |
| Yongxiu | 5639.240 | 9.391 | 0.000 | 67.391 | 18.279 |
| Huku | 996.165 | 676.772 | 206.913 | 1771.110 | 2035.360 |
| Ruichang | 2462.630 | 0.000 | 0.000 | 0.000 | 0.000 |
| Jiujiang City | 699.119 | 16.216 | 76.590 | 850.526 | 1438.220 |
| Duchang | 7478.880 | 3084.700 | 1068.750 | 17616.800 | 5150.540 |
| Xinzi | 10639.800 | 1110.850 | 1572.070 | 7656.030 | 2023.320 |
| Xinjian | 24639.800 | 1412.850 | 2217.230 | 11406.000 | 3110.130 |
| Jiujiangi | 3344.590 | 92.250 | 0.000 | 17.920 | 81.878 |
| Total | 60310.05 | 9736.486 | 5211.259 | 40164.257 | 16560.133 |
Reference:
- Arai K., 1991, Multi-Temporal Texture Analysis in TM Classification. Canadian Journal of Remote Sensing, Vol. 17 No. 3 : 263-270.
- Barber D.G. and Ledew E.F., 1991, SAR sea ice discrimination using texture statistics A multivarice approach, PE&RS, 57(4): 385~295.
- Conners R.W. and Harlow C.A., 1980, A Theoretical Comparison of Texture Alogrithms, IEEE Transactions on Pattern Analysis and Machine Intelligence, 2(3): 204~222.
- Haralick R.M., 1979, Statistical and Structural Approaches to Texture, Proceedings of IEEE, 67(5) 786~804.
- Laws K., 1985, Goal Directed Texture-Image Segmentation. SPIE-Application of Aritifical Intelligence, Vol. 548: 19-26.
- Lee J.H. and Philpot W.D., 1991, Spectral Texture Matching: A classifier for Digital Imargery. IEEE Transaction on Geoscience and Remote Sensing, Vol. 29 No. 4:545-554.
- Sun C. and Wee W.G., 1982, Neighboring Grey Level Dependence Matrix for Texture Classification Computer Vision, Graphics and Image Processing, Vol. 23 :341-352.
- Sun Y., Carlstron A. and Askne J., 1992 , SAR Image Classification of Ice in the Gulf of Bothnia. Int. J. Remote Sensing, 13(13): 2489~2514.
- Wilson P.A., 1997, Rule-Based Classification of water in Landsat MSS Images Using the Zhou Chenghu, Study to information system of flood disaster estimation, 1993, Beijing. Science and technology Published house.
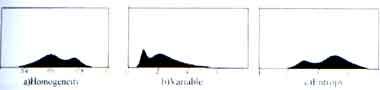
Figure 1: Histogram of texture images
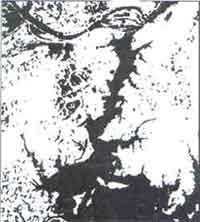
Figure 2:a The extracted water segments using homogeneity feater
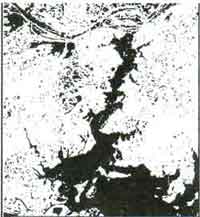
Figure 2:b The extracted water segments using variable feature
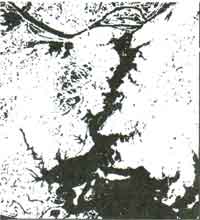
Figure 2:c The extracted water segments using enturpy feature
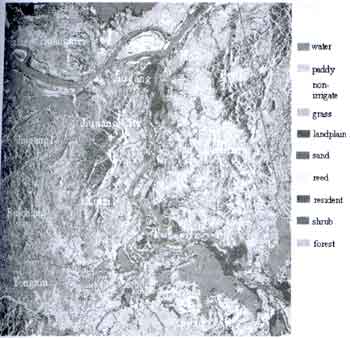
Figure 3: Classification map of land use in flooded area