| GISdevelopment.net ---> AARS ---> ACRS 1998 ---> Poster Session 1 |
Generation of Bathymetric Map
in the North Caspian Sea using Multi-Temporal Satellite Images, Republic
of Kazakhstan
Masataka ochi1),
Minoru hatanaka2), Nobutaka oikawa3) and Takashi
hoshi4)
1)Nikko Exploration & Development Co., ltd.
2-7-10, Toranomon, Minato-Ku Tokyo 105-0001, Japan
Tel: (81)-3-3503-7781, Fax: 3508-9785,
E-mail: ochi@mail.ned-unet.ocn.ne.jp
2)Japan Energy Development Co., Ltd.
2-10-1, Toranomon, Minato-Ku Tokyo 105-0001, Japan
Tel:91)-3-5573-6850, Fax: 5573-6860,
E-mail: m.hatana@-energy.co.jp
3)Earth Remote Sensing Data Analysis Center
3-12-1, Kachidoki, Chuo-Ku Tokyo 104-0054
Tel: (81)-3-3533-9380, Fax: 3533-9383,
E-mail:oikawa@ersdac.or.jp
4)Ibaraki University
4-12-1, Nakanarusawa, Hitachi, Ibaraki 316 -0033, Japan
Tel: (81)-294-38-5133, Fax: 37-1429,
E-mail: hoshi@cis.ibarki.ac.jp
This
study focuses on the limitations and benefits of satellite images when
scouting a near-shore area in the North Caspian Sea, Kazakhstan, for
seismic survey planning purpose. In order to generate a logistic base map
for a seismic survey, the locations of recent transgressive shorelines and
the extent of reed zones were interpreted and extracted from
multi-temporal satellite images. A rise in sea level since 1979 has
resulted in an eastward migration of shorelines and reed zones in the
study area near the Tengiz oil field. The previous locations of these
shorelines were examined in terms of the present depth of water using a
published curve showing changes in Caspian Sea levels. A 1997 bathymetric
map was successfully prepared by an integrated analysis. This bathymetric
map was further interpreted and land cover units were also added as
supplementary information. Finally, five zones are highlighted on the
seismic base map as those to be appropriate sources and receivers for
seismic data acquisitions. 1)Nikko Exploration & Development Co., ltd.
2-7-10, Toranomon, Minato-Ku Tokyo 105-0001, Japan
Tel: (81)-3-3503-7781, Fax: 3508-9785,
E-mail: ochi@mail.ned-unet.ocn.ne.jp
2)Japan Energy Development Co., Ltd.
2-10-1, Toranomon, Minato-Ku Tokyo 105-0001, Japan
Tel:91)-3-5573-6850, Fax: 5573-6860,
E-mail: m.hatana@-energy.co.jp
3)Earth Remote Sensing Data Analysis Center
3-12-1, Kachidoki, Chuo-Ku Tokyo 104-0054
Tel: (81)-3-3533-9380, Fax: 3533-9383,
E-mail:oikawa@ersdac.or.jp
4)Ibaraki University
4-12-1, Nakanarusawa, Hitachi, Ibaraki 316 -0033, Japan
Tel: (81)-294-38-5133, Fax: 37-1429,
E-mail: hoshi@cis.ibarki.ac.jp
Introduction
When conduction a seismic survey in a very shallow water are for petroleum exploration, operational constraints are highly related to surface conditions. Therefore, during planning it is of crucial importance to investigate and analyze conditions such as depth of water, communities of aquatic plants (reed zone) and subsurface geology. However, those conditions are not classified or shown in detail on some published topographic maps. For the reason, a map with the above logistic information using satellite data should be of high value when selecting survey lines and methods. The final goal of his study was to create a base map for a survey design. The significant role of the satellite image interpretation was to obtain the present isobaths and isobaths and distribution sate of the reed zone in the study area.
Study Area Satellite Data Used
The study area is situated in the western part of Kazakhstan and covers the North Caspian Coastal lowland (Caspian Depression) as well as near-shore to very shallow water area, with water depths of less than five meters(Figure 1). This area covers approximately 30,000 km2 and is located in the southern part of the Pre-Caspian Basin where oil and gas potential is very high. Giant oil and gas fields, such as Tengiz oil field and Astrakhan gas field, have been discovered and developed along the coastal lowland. The following multi-temporal satellite images, on a scale of 1:300,000, were used for the study; LANDSAT MS/TM, JERS-1 OVN and RADARSAT SAR (Figure 2).
Current State of Rise in Sea Level
From a long-term viewpoint, changes in sea level of several have repeatedly occurred since the 1600s. From 1977 up to present time the sea level has been continuously rising by up to approximately two meter (Figure 3). Because of this recent rise in sea level, water has been gradually intruding into the coastal lowland, and a serious influence is taking place on harbor and petroleum facilities, roads, etc. around the study area. On the other hand, in terms of seasonal changes, the sea level during summer rises by up to approximately 20 centimeters from the annual mean sea level, and, in turn, falls by approximately 10 centimeters in winter (Figure 4).
Study Contents
This study involved (1) the definition and extraction of shorelines from multi-temporal satellite images, (2) the interpretation of recent changes of shoreline and reed zones, (3) a field verification survey, (4) an estimation of depth of water in 1997 and (5) the generation of a base map for seismic survey planning.
Definition and Extraction of Shorelines
During the period of annual mean sea level (in spring/autumn), the near-shore area is usually submerged up to the landward limit of the perennial dense reed zone which occupies the near-share to very shallow water area annual mean sea level coincides with the landward limit of the reed zone. Thus, the shorelines in 1995, 1985, 1987, 1992, 1993 and 1997 were extracted by means of identification of those limits from multi-temporal satellite images (Figure 5).
Changes of Shoreline and Reed Zone from 1979 to 1997.
The most recent lowest sea level was recorded in 1977 (-29.04 meters above oceanic sea level), which was followed by a continuous rise is sea level (Figure 3). With this rise in sea level the shoreline in the study area has moved landward toward the cat. This gradual rise in sea level extends as much as 40 kilometers, maximum, in the vicinity of the Tengiz on field during 1979 (equal to 1975) to 1997. Due to a 1.92 -meter rise of sea level during the past 18 year (Figure 3), the slightly elevated near-shore area in 1975 (or 1979) have gradually changed into isolated islands (Figure 5)
The reed zone has also moved towards the east almost parallel to the movement of the shorelines (figure 6). This observation explains that perennial reed communities can grow only in very shallow water zone is roughly maintained each year. Reed zones on islands are observable above the sea surface in locations of submerged areas previously elevated.
Depth of Water in 1997
Recognizing the rise of sea level from previous shoreline positions in 1979,1985, 1987, 1992 and 1993, respectively, the depth of water in 1997 can be calculated. This can be done on the assumption that there were no significant changes through erosion or sedimentation in submarine topography of the submerged area during the 18 years 1979. Based on this principle, depth of water in 1997 was obtained using a curve showing recent changes in sea levels. Thus depth of water in 1997 was recongnized through image interpretation by up to approximately 40 kilometers from the shoreline.
1997 Bathymetric Map
Prior to the generation or a base map covering the entire study area, eight submarine topographic profile lines were set up with almost an orthogonal direction to the shoreline in 1997. Subsequently, profiles were drawn considering partial changes of sea bottom gradient created by slightly elevated areas. A 1997 bathymetric map (Figure 7). These pattern can be called a semi-artificial landform because the topographic features were caused by the construction of an embankment.
Generation of a Base Map for Seismic Survey Planning
The above bathymetric map was further interpreted and land cover units were also added as supplementary information. Finally, five zones are highlighted on the seismic base map (figure 8) as those to be sources and receivers for seismic data acquisition. The following methods of measurement were designed respectively in three zones of the very shallow water area among five zones shown in Figure 8.
- Zone A: Approximately less than one meter deep. Explosives and geophones should be applied respectively as source and receiver. A cable or radio telemetry system is preferable as a receiving system.
- Zone B: Depth of water exceeds on to five meters, maximum. Air guns and hydrophones should be applied respectively as source and receiver. A bottom cable or radio telemetry system is preferable as a receiving system.
- Zone R: This is a reed zone along a shoreline. Although depth of water is approximately one meter, a seismic survey could not be conducted by any kind of method during 1997 because deforestation was prohibited within this zone.
- When extracting "the shoreline at annual mean level" from satellite images, the landward limits of the reed along shoreline can be applied for the definition of the shoreline. The previous land area of about 40 kilometers wide has been submerged by a rise in sea level during the period from 1979 to 1997 (18 years) near the oil field.
- The bathymetric map inn the very shallow water area was generated through drawing submarine topographic profiles, and thus the complicated submarine topography was obtained in detail. The land cover were added to this bathymetric map and finally five zones are highlighted on the seismic base map as those to be source and receiver.
- It is very difficult to conduct a seismic survey in a reed along the shoreline without deforestation on the other hand, a shallow water-seismic survey can be conducted in the offshore area, on the basis that an appropriate method of measurement is selected according to the depth of water.
The authors are grateful to Mr. Toru KAWAKAMI, General Manager of the Department of Research and Development of the Earth Remote Sensing Data Analysis Center, for permission to present this paper. They also are much indebted to Dr. Oleg A. FEDORENKO, Yuggeo Co. Ltd, who kindly provided technical support during the field verification survey and Dr. Shuji SATO, General Manager of the Exploration Department of Japan Energy Development Co., Ltd., for critical reading of the manuscript.
Selected Reference
- Nakayama, Y. (1997): Monitoring Changes of Lakes in Central Asia by Satellite Data. Proceeding of the Nihon University International Symposium on Global Environmental and Human Living, p.271-283.
- Sydykov, H.S., Golubsov, V.V. and Kuandykov, B.M. (1995): Caspian Sea and its Coastal Zone. National Scientific Academy of Republic of Kazakhstan, Institute of Hydrogeology and Hydrophysics, Ministry of Science and Technology, Government Company "Kazakhstan -Caspi-Shelf, 211 pp. (in Russian)
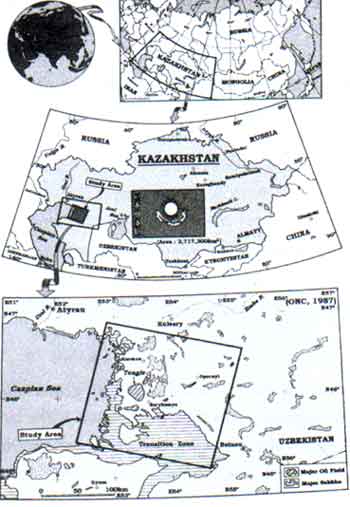
Figure 1. Location Map of the Study Area
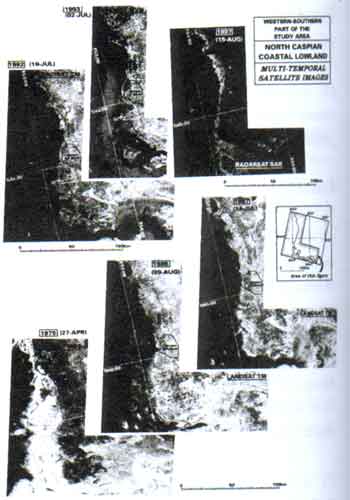
Figure 2. Multi-Temporal Satellite Images

Figure 3. Curve Showing Changes in Caspian Sea Level
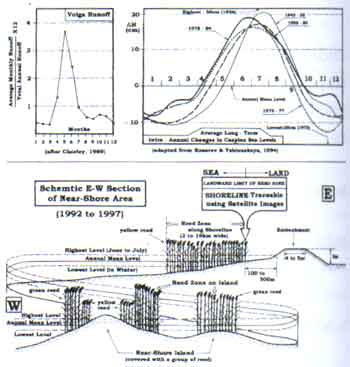
Figure 4. Definition of Shoreline
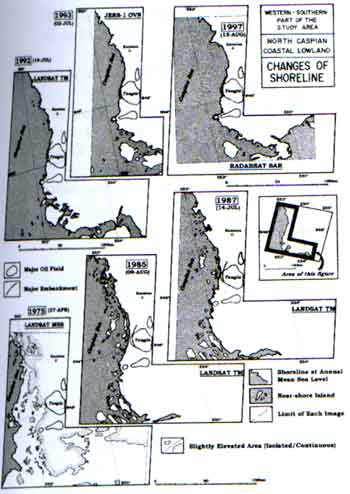
Figure 5. Recent changes of Shoreline
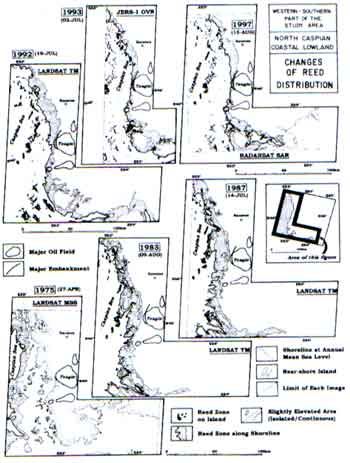
Figure 6. Recent Changes of Reed Distribution
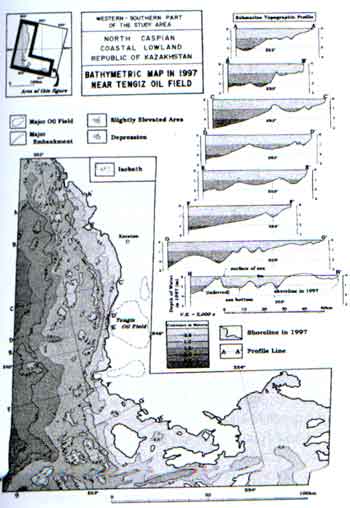
Figure 7. 1997 Bathmetric Map
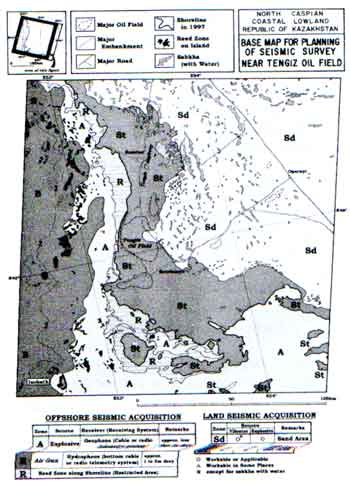
Figure 8. Base Map for Seismic Survey Planning