| GISdevelopment.net ---> AARS ---> ACRS 1998 ---> Poster Session 1 |
Using Stationary Wavelet
Transform in the Classificationof Sar Images
Warin Chumsamrong, Punya
Thitimajshima, and Yuttapong Rangsanseri
Department of Telecommunications Engineering,
Faculty of Engineering
King Mongkut's Institute of Technology Ladkrabang,
Bangkok 10520, Thailand
ktpunya@kmitl.ac.th, kryuttha@kmitl.ac.th
Charnchai Pienvijarnpong
Remote Sensing Ground Station, National Research Council of Thailand
Chalongkrung Rd., Ladkraband, Bangkok 10520, Thailand
Abstract Department of Telecommunications Engineering,
Faculty of Engineering
King Mongkut's Institute of Technology Ladkrabang,
Bangkok 10520, Thailand
ktpunya@kmitl.ac.th, kryuttha@kmitl.ac.th
Charnchai Pienvijarnpong
Remote Sensing Ground Station, National Research Council of Thailand
Chalongkrung Rd., Ladkraband, Bangkok 10520, Thailand
In this paper, a novel method for SAR image classification based on stationary wavelet transform will be described. First, a SAR image is decomposed into 4 subbands using stationary wavelet transform. Each pixel is then represented by a 4-dimension vector whose components are taken from the wavelet subbands. The pixels are finally classified into a small set of categories by using parametric supervised classification algorithm. The classification using this wavelet was successfully applied to a JERS-1/SAR image.
1 Introduction
Remote sensing image data of the earth's surface from the earth resources satellite i.e. ERS-1, JERS-1 or Landsat can be divided into two categories: multispectral image and SAR image. The classification of these images. Applied for studying a change of the earth resources, can be performed by various algorithms i.e. Maximum Likelihood Classification, Minimum Distance Classification, Parallelepiped Classification or Table Look up Classification [1].
In the case of multispectral images, they are consistered of several sub-images or bands and each band is contained with the gray value data. These gray value data are then represented by an N-dimension vector and can be directly classified for such any desired purpose. While SAR images are the single band image which is contained with the multiresolution texture data due to the non-station of microwave's reflection on the ground. The classification of these images without any preliminary analysis usually result in high error rate.
Wavelet transform [2] has been attracting attention in diverse areas such as signal processing and image processing. In this paper, we present a texture classification result utilizing the characteristics of the wavelet transform.
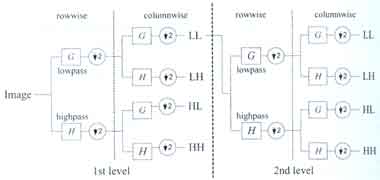
Figure 1: Two-level discrete wavelet tranform.
2 Discrete wavelet transform
The discrete wavelet transform is the most useful technique for frequency analysis of signals that are localized in time of space. It decomposes signals into basis functions that are dilations and translations of a single prototype wavelet function :
Where Ym,n(x)=2-m/2Y(2-mx-n), are obtained by translates and dilates of the wavelet function Y(x). The discrete wavelet transform coefficients Cmn can be calculated by the inner products (Ym,n(x), f(x)) which are the estimation of signal components at (2-mn, 2m) in the Time-Frequency plance.
Actually, the discrete wavelet transform [3] corresponds to multiresolution approximation expressions. This method permits the analysis of the signal in many frequency bands or at many scales [4] [5]. In practice, mutiresolution analysis is carried out using 2 channel filter banks composed of a low-pass (G) and a high-pass (H) filter and each filter bank is then sampled at a half rate (1/2 down sampling) of the previous frequency. By repeating this procedure, it is possible to obtain wavelet transform of any order. The down sampling procedure keeps the scaling parameter constant (n=1/2) throughout successive wavelet transforms so that it benefits for simple computer implementation. In the case of an image, the filtering is implemented in a separable way by filtering the lines and columns. An example can be illustrated in Figure 1.
According to this procedure, the original image can be transformed into four sub-image, namely:
- LL sub-image: Both horizontal and vertical directions have low-frequencies.
- LH sub-image: the horizontal direction has low-frequencies and the vertical one has high-frequencies.
- LH sub-image: The horizontal direction has high-frequencies and the vertical one has low-frequencies.
- LH sub-image: Both horizontal and vertical directions have high-frequencies.
4 The proposed algorithm
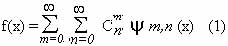
The technique used here for SAR image classification is based on wavelet feature input to a minimum distance classifier, as shown in Figure 2. First, a SAR image is transformed into 4 sub-images using stationary wavelet transform. Each pixel at the same position of these wavelet sub-images in then represented by a feature vector x = [x1x2x3x4]t where t represents transpose. Then, the pixels are classified into a small set of categories by using a parametric supervised classification algorithm.
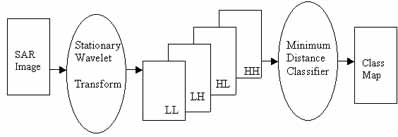
Figure 2: Overall scheme of the proposed algorithm.
The classification algorithm used in our research is based on the minimum distance method. Mahalanobis distance is the most commonly used in remote sensing. The distance measure is defined as:
where the subscript I indicates the number of category to be classified, mi the mean vector of the data in class I, and å the covariance matrix of the data with class.
5 Experimental results
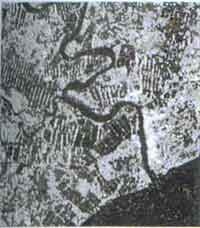
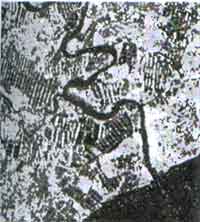
In this paper we have used the SAR image which was acquired by JERS-1 over Chantraburi Province (Thailand). The original image consists of 512 x 512 pixels as shown in the Figure 3(a) and 3(b) shows the LL sub-image which is taken from the 1st level of the stationary wavelet transform at the 2nd level is higher than the 1st level. This is due to the property of wavelet transform. The 4 sub-images at the 2nd level are the low-pass filtered version of the LL image from 1st level, bearing low-frequency information on nighboring pixels. These characteristics contributed to an efficient classification performance.
Figure 3: (a) Original JERS/1/SAR image (b) LL sub-image of the wavelet transform.
| True Class | Clasified as | |||
| Water | Vegetation | Bare Soil | Urban | |
| Water | 93.56 | 6.44 | 0.00 | 0.00 |
| Vegetation | 0.24 | 90.24 | 9.52 | 0.00 |
| Bare Soil | 0.00 | 8.86 | 82.63 | 8.51 |
| Urban | 0.00 | 0.16 | 23.11 | 76.71 |
Figure 4: classification result using the 1st level of the stationary wavelet transform.
| True Class | Clasified as | |||
| Water | Vegetation | Bare Soil | Urban | |
| Water | 97.16 | 2.84 | 0.00 | 0.00 |
| Vegetation | 0.00 | 90.29 | 5.71 | 0.00 |
| Bare Soil | 0.00 | 5.24 | 91.03 | 3.73 |
| Urban | 0.00 | 0.00 | 21.17 | 78.83 |
Figure 5: Classification result using the 2nd level of the stationary wavelet transform.
6 Conclusion
The stationary wavelet transform provides the texture information of SAR images. This information is assigned as the component of the feature vector of a pixel. The classification using this wavelet transform was successfully applied to JERS-1 SAR image. Results indicate a high classification accuracy for all classes except urban. This class is contained with texture information that does not provide a unique feature. It is also seen that the information at the higher level of the stationary wavelet transform can improve the classification accuracy but the appropriate number of wavelet transform executions might be dependent on the quality of original SAR image.
Acknowledgment
The authors with the thank the National Research Council of Thailand (NRCT) of providing the satellite image data.
Reference
- J.A. Richards, Remote Sensing Digital Image Analysis, Springer-Verlag, Berlin, 1993.
- C.S. Burrus, R.A. Gopinath, and h. Guo, Introduction to wavelets and Wavelet Transform, Prentice-hall International, Inc., New Jersey, 1998.
- R.K. Young, Wavelets Theory and its Applications, Kluwer Academic Publishers, Boston, 1993.
- S. Mallat, "A Theory of Multiresolution Signal Decomposition: The Wavelet Representation," IEEE Trans. Pattern Analysis and Machine Intelligence, vol. 11, pp. 674-693, 1989.
- I. Daubechies, "Orthonormal Bases of Compactly Supported Wavelets," Comm. Pure and Applied Mathematics, Vol. 41,no. 7 pp. 909-996, 1988.
- S. Mallat, A Wavelet Tour of Signal Processing, Academic press, San Diego, 1988.