| GISdevelopment.net ---> AARS ---> ACRS 1998 ---> Poster Session 1 |
Precision Fishing
S.B. Mansor, M.I. Mohamed
and K.Kassim K.Yaakob
Department of Civil Engineering
Department of Environmental Science
University Putra Science
Serdang, Selangor.
E-mail: shattri@eng.upm.edu.my
E-mail: mibrahim@fsas.upm.edu.my
Abstract Department of Civil Engineering
Department of Environmental Science
University Putra Science
Serdang, Selangor.
E-mail: shattri@eng.upm.edu.my
E-mail: mibrahim@fsas.upm.edu.my
This major project involving several objectives and phases to meet the goal of development a satellite-based fishery forecasting system in the South China Sea is aimed at supporting the national aspirations of developing an efficient offshore fishery. More importantly, it is aimed at providing the basis for alternate ways towards meeting the sustainable harvest of fishery resources. To data, the first phase of the project is completed with the development of an efficient extraction algorithm of sea surface temperature of South China Sea, which includes automatic geocoding, cloud masking and land masking. A GIS model of historical fish catch and oceanographic database for satellite and ship-land masking. A GIS model of historical fish catch and oceanographic database for satellite and ship-based data is currently being developed. Preliminary results show a clear correlation f fish catch areas with the present of warm waterfronts of Malaysia continent. The study will now go into the second phase to produce a GIS-based system for predicting potential fishing zones by seasons.
Introduction
The use of remote sensing to provide synoptic measurements of the oceans is becoming increasingly important in fisheries research and fishing operations. Variations in ocean conditions play key roles in natural fluctuations of fish stocks and in their vulnerability to harvesting [1].
Information on the changing ocean is necessary to understand and to eventually predict the effects of the ocean on fish population. The evolving capabilities of satellite sensors and data processing technologies combined with conventional data collection techniques and GIS modeling provide a powerful tool towards fish forecasting and thus allowing sustainable management of living marine resources.
Techniques in the development of fishing grounds have used such oceanographic phenomena as upwelling areas, temperature fronts, ocean color and the presence of large amounts of chlorophyll in the water as indicators of areas of fish stock congregations and fish stocks migration. Sea surface temperature and salinity and other oceanographic conditions can further assist to develop these areas known as potential fishing zones for forecasting of natural fluctuations of stocks, their congregations and migrations.
With the advent of satellite oceanographic, these oceanographic features such as ocean color, sea surface temperature, chlorophyll-a-concentrations can be successfully mapped in near real time basis. This capability coupled with the knowledge oceanographic conditions affecting fishery population and historical catch data can lead towards forecasting of fish populations and their
Movements and thus afford the capacity to harvest the fishery resources effectively and equally important on a sustainable basis [2].
Material and Methods
The overall goal of the project is to develop an efficient system for fish forecasting in the South China Sea and make this information available to the fisherman and other stakeholders through a fishery information system. To achieve this goal, the project has to meet several defined objectives viz.
- To develop an efficient sea surface extraction algorithm for NOAA AVHR data.
- To produce potential fishing zone (PFZ) maps from oceanographic data using GIS techniques.
- To verify this PFZ maps with actual historical fish catch data.
- To develop an effective and efficient real time fish forecasting technique for the South China Sea.
- To develop a GIS -based decision support system for predicting fishing grounds.
- To disseminate the information through an IT based fishery information system.
In phase 1 of the project which is now completed, the project developed automatic geocoding of the NOAA AVHRR data, operationalize five methods of cloud masking techniques and develop the algorithm for quick sea surface temperature extraction for the tropical areas [3]. Concurrently, oceanographic data obtained from SEAFDEC fishery/oceanographic surveys. The Royal Malaysian Navy, PETRONAS and other oceanographic expedition [4] are obtained and a GIS model enveloping these data are being developed.
Historical catch data of pelagic fish for the South Chine Sea for the three east coast states of historical Trengganu and Johore for the year 1992 to 1997 are being gathered and organized according to monsoon season. This will then be used to verify the initial forecast maps for the area.
Operational sea surface temperature
In the 10.0 to 12.5 atmospheric window, the atmospheric absorption and re-emissions is principally due to atmospheric water vapor. The Spatiotemporal Split Window Technique (SSWT) method takes advantages of the differential absorption in the window region to correct the atmospheric effects [6]
Sea surface temperature Ts was extracted from the following relation.
Where, Ts is surface temperature, T4 and T5 are respectively the radiometric temperature in two adjacent AVHRR channel of 11 and 13 mm, a0, a1 and a2 are are coefficients which depend on the surface emissivities, atmospheric absorption coefficients and total vapor amount. These coefficients can be computed from
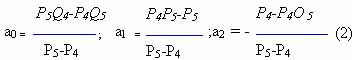
Where
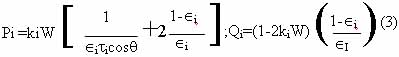
where Li=Ti/n and the value of n for NOAA-14 AVHRR channels 4 and 4 are4.51 and 4.13 respectively (for a temperature range of 290-310K).
The performance of AVHRR based multichannel sea surface temperature had been shown by [5] used in this work of comparison. The multichannel sea temperature algorithum has two parts. (i) dytime MCSST algorithm as equation (4); and ii) nighitime MCSST algorithm as equation (5).
Ts=3.6139 T4-2.5789 T5-283.21 (5)
Where T4T5 are the brightness temperatures (in degree Kelvin) by the AVHRR on the NOAA operational spaceraft and T5 sea surface temperature in degrees Celsius. This algorithm was successfully implemented by [5]
Result and Discussion
fFigure 2, and 3 show the sea surface temperature map of the South China Sea off the Peninsular Malaysia coastline. The data on the SST raging from 28oC to 32. 5oC with 0.5C interval is shown. Clearly, the amount of cloud cover require some kind of mosaic of the data of r the whole season to persistent tongues of warm water that extent southward from the north is clear in all the data. This description of warm water intrusion into the south China Sea from the Gulf of Thailand was first reported in the Matahari Expedition report [4].
The thematic maps of historical catch data shown as Figure 4 also holds some interesting observations, Clearly in the first estimation, the correlation between the catch and that of the warm front is very high. Other thematic maps presently developed also show such high correlation between the warm waterfronts and the catch of pelagic fish off the coast of Peninsular Malaysia.
These results are obviously very preliminary. We have yet to determine the presence of upwelling of the coast of Trengganu during the South West Monsoon. The occurrence of the chlorophyll-a concentration and the pattern of sea surface temperature for the South China Sea for the North East, South West monsoon and two other inter-monsoon periods. Much needs to be done before a definite result can be reported.
Studies on ocean color, chlorophyll-a, upwelling and other oceanographic phenomena have yet to be done. This will provide the missing pieces towards assembling this jigsaw of oceanographic date from historical fish catch data and GIS-based decision support system for forecasting fishing grounds.
Conclusion
This major study to develop a real time fish forecasting system for the South China Sea is a bold attempt to assist the nation to achieve its aspirations to develop its offshore fishery and to harvest the fishery resources in a sustainable manner. Preliminary results of the study showed tremendous potential towards achieving the desired objectives. Several major parts of the study still requires detail research and then to be incorporated into the overall scheme of the study. We welcome comments as well as other interest collaborators to work on the project to achieve this potential powerful tool on fishery development and management.
Acknowledgement
The author acknowledge the financial support of IRPA funds from the Malaysian Government, the logistic and other support from the University Putra Malaysia, research assistance and graduate students working on the various aspects of the project to make it successful. AVHRR data was made available by SEAFDEC Trengganu.
Reference
- Anon, 1993, International Workshop on Application of Satellite Remote Sensing for Identifying and Forecasting Potential Fishing Zones in Developing Countries. Organized by Deparment of Space, national Remote Sensing Agency (NRSA), Hyderabad and Committee on Science and Technology in Developing countries of the International Council of Scientific Unions (Costed/ICSU), Madras, Hyderabad, India. 7-11 December 1993.
- Mohd. Ibrahim Mohamed. 1996, Pacific Ocean Remote Sensing Conferecne, PORSEC '96, Victoria, B.C.
- Hassan, Q.K. 1998, Near Real Time processing of NOAA AVHRR Satellite Data. Master Thesis. Faculty of Engineering, University Putra Malaysia, Serdang, Selangor.
- A.K.M. Mohsin, M.I Mohamed & M.A. Ambak (eds) 1996. Expedisi Matahari '85: A Study on the offshore waters of Malaysian EEZ, Faculty of Fisheries and Marine Science, University Pertanian Malaysia. Occasional Publication No. 3.
- E.P. McClain, W.G. Pichel, and C. C. Walton, "Comparative performance of AVHRR-based multichannel sea surface temperature", J. of Geophysical research, vol. 80, pp. 5113-5117, 1985.
- S.B. Mansor, "Quantitative analysis of thermal infrared satellite infrared satellite data for geophysical investigations", PhD. Dissertation, University of Dundee, 1993.
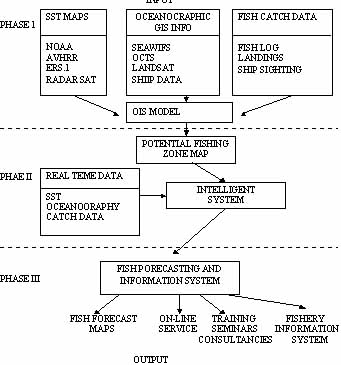
Figure 1: Activity and Project Phase
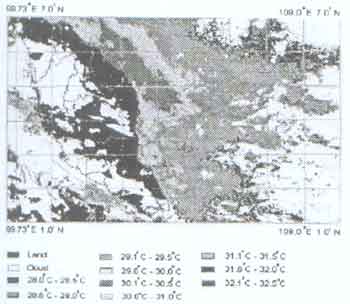
Figure 2: SST from MCSST algorithm (NOAA-14 AVHRR, April 10, 1996) GMT 7:35[1]
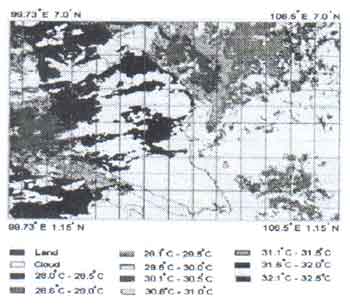
Figure 3: SST from SSWT algorithm (NOAA-14 AVHRR May 8, 1996)GNT 6:32[1]
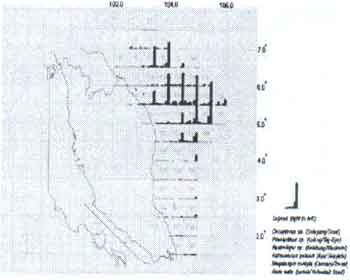
Figure 4: Historical Fish Catch Data for North East Monsoon 1995 covering Peninsular Malaysia's east coast (Catch provided by Department of Fisheries Malaysia)