| GISdevelopment.net ---> AARS ---> ACRS 1998 ---> Oceanography/Meteorology |
Correction of non-uniform
aerosol effect of Landsat TM image by using blockwise approached
atmospheric correction model (BACM)
Chien-hui
Liu
Department of Management Information System, Transworld Junior college of Commerce,
Tel: (886)-5-5570-866 Fax: (996)-5-5570-869
E-mail: chliu@ws231.tjcc.edu.tw
E.F. Vermote
Department of Geography, University of Maryland, College park, USA
Tel: (1)-301-286-6232 Fax: (1)-301286-1775
Abstract.Department of Management Information System, Transworld Junior college of Commerce,
Tel: (886)-5-5570-866 Fax: (996)-5-5570-869
E-mail: chliu@ws231.tjcc.edu.tw
E.F. Vermote
Department of Geography, University of Maryland, College park, USA
Tel: (1)-301-286-6232 Fax: (1)-301286-1775
An blockwise approached atmospheric correction model (BACM) for correting non-uniform aerosol effect is developed in this paper. By using the dense dark vegetation, non-uniform aerosol optical depth can be retrieved in every specified block of image. Three Landsat TM images in LTER sites including two Hog Island images of uniform aerosol effect and one Madison of non-uniform aerosol effect are used to testify BACM. The results show that the mean errors of retrieved aerosol optical depths in these three images are 0.14 and 0.05 in TM1 and TM3 bands by comparing the field measurements from AERONET. Higher aerosol optical depth (t (TMI) =0.84) in the hazier region is derived compared with lower value (t(TM1)=0.62) in the clearer region of Madison scene. Non-uniform aerosol effect is then well corrected. Although in lack of field measurement, typical bare soil and vegetation reflectance can be retrieved even I the very hazy region (visibility~5km) of the scene after atmospheric correction.
Introduction
Quantitative analysis of remotely sensed data relies on the accurate correction of atmospheric effect, since modulation of the atmosphere impedes many applications of multi-temporal satellite images, such as agriculture monitoring (hill and Sturm 1991), land-cover change, remote sensing of surface albedo and classification (Liu and Chen 1995). Therefore, it is indispensable to convert the digital count of satellite image to surface reflectance which is reasonably independent of atmosphere and better related to the surface characteristics (Moran et al. 1992).
Dense dark vegetation (DDV) algorithm for land developed by Kaufman and Sendra (1988) is now the most widely used method (Richter 1996, Liu et al. 1996) to retrieve aerosol optical depth, because of the stable and low reflectance in the visible bands. This algorithm Is not very satisfactory, since the normalized difference vegetation index (NDVI) used to select DDV is affected by the aerosoland thus tends to select pixels with low aerosol concentration given sililar surface reflectance (Holben et al. 1992, Kaufiman and Tanre 1996). Based on the less sensitivity to aerosol scattering in longer wavelength (e.g. mid-IR 2.2 mm or 3.7 mm) and still sensitive to surface characteristics, global remote sensing of aerosol and subsequent atmospheric correction procedure for AVHRR and future ESO-MODIS has been developed (for details, se Kaufman and Tanre 1996, Kaufman et al. 1997). Alternative way to correct the non-uniform aerosol effect by DDV algorithm from NDVI is to partition the remote sensing image into blocks (or sectors, Richter 1996), which are assumed with uniform aerosol.
In this paper, a blockwise approach Atmospheric Correction Model (BACM) is developed to correct the non-uniform aerosol effect of Landsat TM images. Evaluation of retrieved aerosol optical depths is made possible by comparison with the field measurements from AERONET (Holben et al. 1997).
Atmospheric correction model for non-uniform effect
To correct the non-uniform aerosol effect, Blockwise approached Atmospheric Correction Model (BACM) is developed. Those include geometry (sun and sensor), date, image (e.g., blocksize to correct non-uniform aerosol effect, window size to correct adjacency effect), sensor (absolute radiometric calibration coefficients to convet the DC to radiance), molecule (scattering and absorption optical depths), aerosol (refractive index, Junge parameter and size range) and DDV assumption (f1,f2, f3 and rddv in blue and red for landsat TM, or green and red for SPOT HRV). At first, the total image is divided to Nx*Ny blocks where uniform aerosol effect is assumed in every block. The fraction f1* and f2* in every block are then equal to f1/(Nx*Ny) and f2(Nx*Ny) respectively. DCddv for retrieving he aerosol optical depths in TM1 and TM3 bands in very block are then determined by using the three parameters f1, f2 and f3 (e.g. 0.2, 0.5 and 0.01). Look-up table (LUT) between digital count and aerosol optical depth at assumed reflectances rddv (0.01 and 0.02 in blue and red bands, respectively) Kaufman and Tanre 1996) is used to derive aerosol optical depth by determined DCddv for every lock. Angstrom formula (Angstrom10064) is used to interpolate the aerosol optical depths in the other TM bands. Surface reflectance image with uniform target assumption can be obtained through LUT between digital count and surface reflectance at derived aerosol optical depths. In practice, spherical albedo rs, total upward transmittance T(mv), upward diffuse transmittance td(mv)and upward beam transmittance exp(-t/mv) are computed and stored for every block to correct the adjacency effect (equation 15, Liu et al. 1996). Window size is specified about 1 km, which is approximately the same as Richter (1990)
Data description
There subseted Landsat TM images (1000*1000 pixels) which are the test sites of NSF LTER (National science Foundation, Long-Term Ecological Reseach) project are used to testify the model. Two images scanned in July 12 and July 28 1993 are located in Hog Island (HI), the other one scanned in June 22 1995 is located in Madison (MD). Their solar Zentith angles are all bout 30.50. the sunphotomether-measured aerosol optical detpths which are available from the AERONET (Holben et al. 1997) denote that HI-12jul 93 image with t (TM1) =0/69 is much hazier than HI-28jul93 with t (TM1)=0.25 (table 1), HI scenes are all in uniform atmospheric effect, whereas MD scene shows non-uniform aerosol effect (hazier in the lower part). HI scenes contain near sea-shore oceans and most of agricultural lands combined with crops and bare soils. The MDS scene contains different laandcovers, such as forest lake, urban and bare soil.
Results and discussions
Table 1 shows the derived aerosol optical depths (with /without iteration) and their error D t to the field-measurements in TM1 and TM3 bands. Highly abnormal derived in (>4.0) by using theu iterative procedure results large D t(-0.14~0.36 ) in TM1 band. Reasonable u should be in range of 2 (dust) ~ 4 (smoke) (Kaufman and Tanre 1992). Mean errors of D t by iterated method are 0.25 and 0.12 in TM1 and TM3 bands which are larger than non-iterated method (0.14 and 0.05). In evaluation the accuracy of accuracy of retrieved t in MD-22 jun 95 scene with non-uniform aerosol effect, the retrievedt s of central four blocks are averaged (table 2). The ranges of retrieved t (TM1) and t (TM3) are 0.62 ~ 0.84 and 0.29-0.53 respectively, which account for the spatial variation of aerosol concentrations in MD-22jun95 scene. Retrieved aerosol optical depths are larger in lower part of image than upper part (e.g. 0.82 and 0.62 in lower left and upper left corner in TM1 band), which are also conforming to diverse haziness of MD-22jun 95 scene. After atmospheric correction, the non-uniform aerosol effect is well removed.
After above discussions, therefore, the accuracies of retrieved aerosol optical depth (i.e. 0.14 and 0.05 in TM1 and TM3 bands) should be satisfactory, since the error of retrieved surface reflectance is about 0.01 ~ 0.02 as shown in the previous study (Liu 1995).
Although surface reflectance measurements are not available, the typical bare soil and vegetation reflectance spectra can be obtain after atmospheric correction even in the very hazy part (e.g. t (TM1) = 0.84 , visibility ~ 5km) of the MD -22jun95 (figure 1).
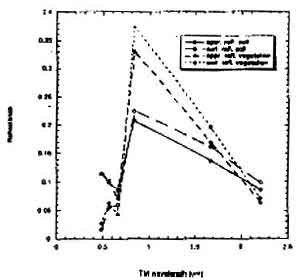
Figure 1. The apparent and surface spectra of bare and vegetation extracted from the very hazy part (visibiligy~5km) of MD -22jun95 scene.
Conclusion
An atmospheric correction model (BACM) is developed for correcting the non-uniform aerosol effect of Landsat TM images by using the blockwise approach. A sensitivity study of aerosol characteristics such as optical depth, single scattering albedo,phase function and Junge parameter has shown that large error of retrieved aerosol optical depth (~0.3) can be caused due to he error of derived Junge parameter in the iterative procedure. Therefore, a fixed model is used.
The results show that the accuracies of the retrieved aerosol optical depths are encouraging (D t <0.2), by comparing the error of retrieved surface reflectance (0.01 ~ 0.02) made in the previous study. Non-uniform aerosol aerosol effect of image is also well corrected. After atmospheric correction, typical bare soil and vegetation reflectance spectra can e acquired.
The major limitation of BACM is the requirement of DDV target in scene and a priori knowledge of blocksize to perform correction of non-uniform aerosol effect. The errors of retrieved aerosol optical depth and surface reflectance will be increased, if the image covers less dense and dark target, such as in semi-arid area. Blockwise approach will be less satisfactory, if the aerosol distribution on image is highly non-uniform, such as plume. Therefore, more studies should be done to assess the algorithm.
Acknowledgement
This work is supported by both post-doctoral scholarship from Ministry of Education of Taiwan and NSF LTER project of US.
Reference
- Hill, J., and Sturm, B., 1991, Radiometric correction multitemporal thematic mapper data for use in agricultural land-cover classification and vegetation monitoring, International Journal of Remote Sensing, 12, 1471-1491.
- Holben, B.N., Vermote, E., Kaufman, Y. J., Tanre, D., and kalb, V., 1992, Aerosol retrieval over land from AVHRR data-application for atmospheric correction. IEEE .Transactions on Geoscience and Remote Sensing, 30, 212-222.
- Holben, B.N., Eck, T.F., Slutsker, I., Tanre, D., Buis, J.P., Setzer, A., Vermote, E., Reagan, J. A., Kaufman, Y.J., Nakajima, T., and Lavenu, 1997, Multi-band authomatic sun and sky scanning radiometer system for measurement of aerosols. Remote Sensing of Environment, forthcoming.
- Kaufman, Y.J., 1994, Atmospheric effects on remote sensing of surface reflectance. SPIE Society of Photo-Optical Instrumentation Engineers, 475, 20-33.
- Kaufman, Y.J., and Tanre, D., 1992, Atmospheric resistant vegetation index (ARVI) for EOS MODIS. IEEE. Transaction on Geoscience and Remote Sensing, 30, 261-270.
- Kaufman, Y.J., Tanre, D., Remer, L.A., Vermote, E. F., Chu, A., and Holben, B.N., 1997, Operational remote sensing of troposphericaerosol over the land from EOS-MODIS. Accepted by Journal of Geophysical Research-Atmosphere.
- Liu C.H., 1995, Radiometric correction of SPOT satellite imageries. Ph. D. dissertation, National Central Univerisity., Taiwan, 172pp.
- Liu, C.H., and Chen, A.J., 1995, An improved spectral knowledge for multi-temporal image classification a case study of urban area. Proceedings of the International Geoscience and Remote Sensing Symposium, Firenze, Italy, 10-14 July 1995 (Piscataway, NJ:IEEE), pp. 1279-1281.
- Liu, C.H. Chen, A.J., and Liu, G.R., 1996, An image-based retrieval algorithm of aerosol characteristics and surface reflectance for satellite images. International Journal of Remote Sensing, 17, 3477-3500.
- Moran, M.S., Jackson, R.D., Slater, P.N., and Teillet, P.M., 1992, Evaluation of simplified procedures for retrieval of land surface reflectance factors from satellite sensor output. Remote Sensing of Environement, 41, 169-184.
- Richter, R., 1996, A spatially adaptive fast atmospheric correction algorithm,. International Journal or Remote Sensing, 17, 1201-1214.
- Vermote, E., 1995, Atmospheric correction software for Landsat 5 Thematic Mapper data set. NASA/GSFC, Technical Report, 89 p.
- Vermote, E.F., Tanre, D., Deuze, J. L., Herman, M. and Morcette, J. 1997, Second simulation of the satellite singnal in the solar spectrum, 6S: an overview. IEEE. Transaction on Geoscience and Remote Sensing, 35, 675-686.
|
| |||||||||
| Site-Date | Field | D t | |||||||
|
| |||||||||
| Measurement | Iterationa | No Iterationb | TMSACd | ||||||
|
| |||||||||
| TM1 | TM3 | TM1 | TM3 | u | TM1 | TM3 | TM1 | TM3 | |
|
| |||||||||
| HI-12jul93 | 0.69 | 0.43 | -0.25 | -0.19 | 4.0 | 0.09 | -0.02 | 0.08 | 0.06 |
| HI-28JUL93 | 0.25 | 0.15 | 0.36 | -0.03 | 7.2 | 0.19 | -0.03 | -0.11 | 0.01 |
| MD-22jun95c | 0.56 | 0.25 | -0.14 | -0.14 | 4.0 | 0.13 | 0.1 | 0.11 | 0.14 |
|
| |||||||||
b u is set to 3.3 which corresponds to continental model.
c derived aerosol optical depth is the average value of the center four blocks. See table 2 and context.
d r-/r1=2.4, r7/r3=1.35 for pixels selected r7=[0.015, 0.05] (see context).
Table 2. Retrieved aerosol optical depths in TM1 and TM3 bands for every block of MD -22jun95 image which contains non-uniform aerosol effect. Values in parenthesis are (t (TM1), t(tm3)) respectively.
| (0.62,0.29 ) | ( 0.62,0.29) | ( 0.64,0.37) | ( 0.64,0.37) |
| ( 0.64,0.33) | ( 0.64,0.33) | ( 0.66,0.33) | ( 0.64,0.33) |
| ( 0.74,0.45) | ( 0.70,0.37) | ( 0.70,0.37) | ( 0.72,0.37) |
| ( 0.82,0.49) | ( 0.84.0.53) | ( 0.82,0.49) | ( 0.82,0.49) |