| GISdevelopment.net ---> AARS ---> ACRS 1998 ---> Mapping From Space |
Generated Reference Ground
Control Points from SAR Image
Sompong Wisetphanichkij,
Kobchai Dejhan, Fusak Cheevasuvit, Somsak Mitatha and Somnuk
Yartpramot
Facility of Engineering and Resear5ch Center for communication and Information Technology
King Mongkut's Institute of Technology Ladkraband, Ladkrabang,
Bangkok 10520, Thailand
Tel: 66-2-3269967 , 66-2-3269081, Fax : 66-2-3269086
E-mail : kobchai@telelan.telecom.eng.kmitl.ac.th
Chanchai Pienvijarnpong
National Research Council of Thailand
MOS-I Receiving Ground Station , Ladkrabang, Bangkok 10520, Thailand.
Chatcharin Soonyeekan
Faculty of Engineering, Kasem bundit University
Pattanakarn Road, Klongton , Bangkok 10250, Thailand
AbstractFacility of Engineering and Resear5ch Center for communication and Information Technology
King Mongkut's Institute of Technology Ladkraband, Ladkrabang,
Bangkok 10520, Thailand
Tel: 66-2-3269967 , 66-2-3269081, Fax : 66-2-3269086
E-mail : kobchai@telelan.telecom.eng.kmitl.ac.th
Chanchai Pienvijarnpong
National Research Council of Thailand
MOS-I Receiving Ground Station , Ladkrabang, Bangkok 10520, Thailand.
Chatcharin Soonyeekan
Faculty of Engineering, Kasem bundit University
Pattanakarn Road, Klongton , Bangkok 10250, Thailand
The precision of geometric correction depends on the number of ground contrl points (GCP). The GCPs are seleced from the accentuated features such as the building and the intersection of roads and etc. Anyway, these kinds of features are difficult to define, if and images ot be covered by fog or cloud. On the other hand, it will be clearly appeared on the SAR images, since SAR image obtained form the reflectance of the microwave wavelength which propagates through even the cloud. The coordinate of GCPs of SAR image are obtained by segmenting techniques, such as, gray level slicing, inverse linear transformation and images exclusion . the SSDA ( sequential similarity detection algorithms ) has been adopted to carry out the relationship of GCPs on SAR and other image. Therefore, the GCPs of SAR will be transformed and referred as GCPs reference for geometric correction of any image.
Introduction
To analyze the imagery problem is obtained by remote sensing device, that covers the sensor errors can be broadly categorized as geometric and radiometric distortion.
-Geometric distortions
the sensor errors in this category; are characterized by a geometric or spatial distortion of the image. The error sources are due to the internal ( sensor -related ) and external errors ( such as platform attitude, scene characteristics ), are shown in fig 1.
-Radiometric distortions
Radiometric distortions are characterized by an incorrect intensity distribution , spatial frequency filtering of the scene data , blemishes in the imagery, banding of the images data, and etc. these distortions are caused by camera or scanner shading effects, detector gain variations, atmospheric and sensor induced filtering, sensor imperfections, sensor detector gain errors, and etc. the digital techniques to reduce the effects for radiometric distortion are presented in previous papers [1-3]. In such problem geometric correction can be subdivided into two parts :1) determination of the warping function which will transform the geometry of the scene to the desired geometric coordinate system ; and 2) processing of the digital image intensity samples, given the warping function to produce image samples on the desired coordinate grid. The later process called " resampling " . for precision of geometric correction depends on the number of ground control point (GCPs). The reference GCPs are selected from the accentuated feature such as the building, the intersection of roads and divergence of river/canal, and etc. these kinds of features are clearly appeared on the SAR image. Therefore, the coordinate of GCP of enhanced SAR image simply obtained by gray level slicing as discussed in next section. Section 3 shows the normalized static correlation measurement technique based on Sequential Similarity Detection Algorithms (SSDA) used for finding the relationship during SAR sub image, where contain the GCP and the other image. The GCPs of SAR will be transformed and referred as GCPs reference for geomet4ric correction for any image. Experiments and results are performed and shown in last section.
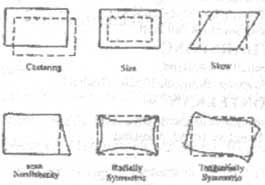
(a) Typical sensor internal distortions
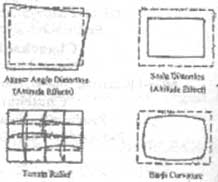
(b) Typical sensor external image distortions
Fig.1 Characteristic of geometric image distortions
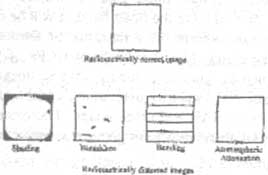
Fig.2 Characteristic radiometric image distortions
SAR's GCPs Extraction
The synthetic aperture radar (SAR) is an active sensor and con be used ot observe the earth in the day and night by regardless the weather . the microwave wavelength propagates through the cloud, it has the higher resolution than the ordinary radar according to the synthetic aperture and pulse compressing technology. Radar transmits the pulse of microwave power to the target and records the reflected signal. This action occurs in geometrical form for recording the side looking vies. The energy of back-scattering signal extremely depends upon the incident angle and eh direction of receiving antenna. All information can be used to build up the SAR image. The back-scattering has two position as follows ;
- object surface area or surface scattering, and
- object inside-volume or volume scattering
The absorbed energy type of object depends on the dielectric constant and it is an important factor reflected wave such as dry soil. It has an little effect with the microwave propagation. On the other side for living area such as bridge, building, concrete road which are constructed from steel and concrete, the dielectric constant is small. The reflection is high and the white color appears clearly on SAR image. Therefore, the black color appears on SAR image for river, canal, asphalt road but the white color appears on SAR image for building, concrete road. Then, the generate reference ground control points(GCPs) cane be easily done .
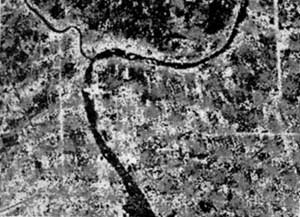
Fig .3 shows an SAR image of upper area of Bangkok metroplitan
It is obviously sown that the Chao Pharya river , canal and asphalt road are in black color . the concrete road is in white color. Therefore, to assign the position of GCPs cab e obtain form the road intersection, water intersection, it is necessary to invert the image color for river, canal and asphalt road to be white color by using linear gray scale inversion as in
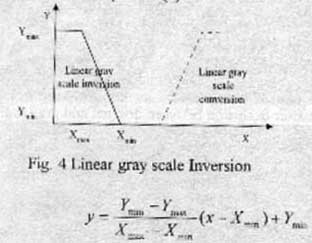
X min , Xmax = lower and Upper range of input image
Ymin - Ymax = Lower and Upper range of output image
Figure 5 shows the image after gray scale inversion, both images must be exclusively together in together tot get rid of the background and the unwanted information. In the image, there are different color appearing on the image , for the other information, the adjacent color are appearing on the image, for the other information, the adjacent color are suppressed as shown in figure 6. it is obviously that the river and canal will be white color, thus the intersection of road and river ( or canal ) will be assigned as typical GCP for transforming to be the other image.
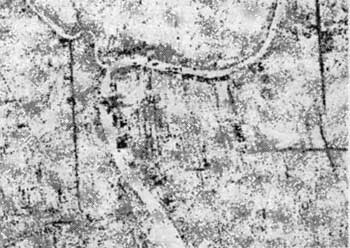
Fig. 5 the result image obtained by using gray scale inversion method
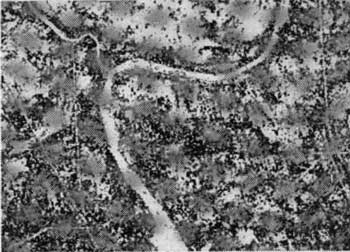
Fig. 6 Image after exclusion between original and gray scale inversion image.
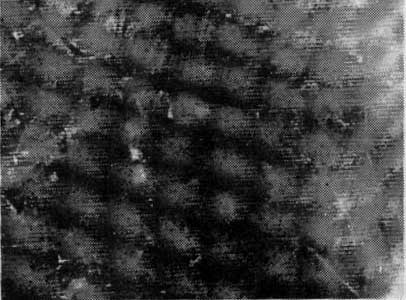
Fig. 7 Received OPS from JERS-1 on 16 January 1998 for the same area of SAR (Fig.3)
sequential similarity detection algorithms technique (SSDA)
After the transformation of GCP, the obtained result image in te previous section and OPS image as shown in figure 7 will be divided in order to determine the specific area such as road intersection, river intersection. The subimage will pass to the registration process. It is and inherently basic requirement for any image processing system. Te SSDAs in this paper are efficiently digital implementation for determining correspondent prints translation will yield the required registration . this paper does not concern about the problem of arising form magnification and rotation . however, the method are applicable for the proper modification.
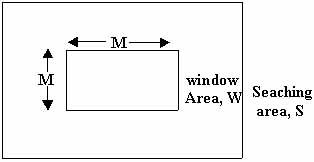
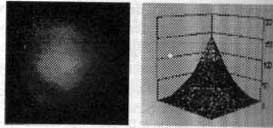
Figure.8 Illustration of Search Space
Let two subimage, S the search area, and W the window is defined as shown in figure 8. the usual normalized correlation is defined as follow [2].
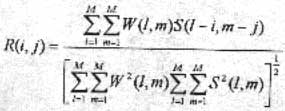
The reference image from SAR image enhancement consists of the details concerning about road and river ( canal ) which are used to generate GCPs as the OPS ( Optical Sensor ) image should be corrected. There are fog and the oher information appearing with road and river, thus the SSDA technique by using normalized correlation (2) is quite difficult and the high misregistratonn is possible. This paper proposes to apply the static correlation measurement. The die correlation by convolution the OPS subimage with whitening filter [5] as follow.
|
r=0 |
r=1.0 |
r is the adjacent element correlation and 0<r<1 . for r=0, the correlation is normally and no decorrelate. AS r is increased, especially r=1, the correlatin occurs as edge detection and the whitening filter is in the gradient operation
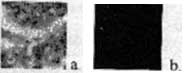
Fig.9 Decorrelated result by convolution with whitening filter, when r=0 and 1, respectively.
 (a) Correlation result r=0 |
 (b) Correlation result r=1.0 |
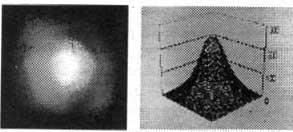
| Fig. 10 Results from static correlation measurement | |
Experimental Results
The static correlating measurement for specific area is used by using he sub image of OPS and SAR images which has the peak opposition and assigning to be GCP of image. Having used this method by applying with the road intersection and river ( canal ) intersection will obtain the enough GCP points for doing the geometric correction but it depends on the selected spatial transformation method . Such as the bilinear interpolating uses 10 points as the cubic spine interpolation uses 16 points. Figure 10 shows the image which is generated by GCP form SAR image. In this case will show only 4 point, but the correction depends on the quality of OPS sub images. The quality means the percentage coverage area of cloud, fog .
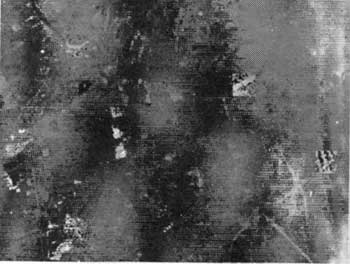
Fig .11 Generated GCPs on OPS by SAR image
If there are a lot of cloud, the generate GCP may not by used. As the small cloud or some part, the generate GCP may be easily.
References
- R.Bernstein and H.Silverman , "Digital techniques for earth resource image data processing ," Aeronautics and Astronautics 8th Annu. Metting, Vol C21, AIAA paper no. 71-978, oct .1971.
- P.M. Bakis and R.Wesley, ERTS Program : Final report on an all -digital approach to image processing for ERTS, IBM Research Center, Yorktown Heights , New York , March 1970.
- P.M.Bakis and R.Wesley, " Digital images processing for the earth resources technology satellite data," ASP Meeting, Washington D.C. , March 1971.
- R.C.Gonzalez and R.E.Woods, Digital images processing, Addison-Wesley Publishing Company, USA , sep. 1993.
- W.F. Webber , " Techniques for image registration ," IEEE Conf. on Machine Processing of Remotely Sensed Data , pp. 1B.1-1B.7, Oct. 16-17, 1973.