| GISdevelopment.net ---> AARS ---> ACRS 1998 ---> Mapping From Space |
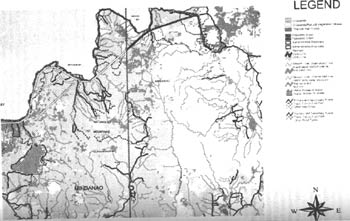
Construction of a Global Map
Around Mindanao, Philippines
Jose Edgardo L.
Aban
Philippine council for Advanced Science and Technology
Research and Development
department of science and technology
dost compound, gen. Santos Ave.,
Bicutan, Tagig, Metro Manila
Tel: (632) 837-7522 Fax: (632) 8373168
E-Mail: egay@sun1.dost.gov.ph
Abstract :Philippine council for Advanced Science and Technology
Research and Development
department of science and technology
dost compound, gen. Santos Ave.,
Bicutan, Tagig, Metro Manila
Tel: (632) 837-7522 Fax: (632) 8373168
E-Mail: egay@sun1.dost.gov.ph
A 1-kilometer resolution Global Map, Philippines was constructed using data from the Digital Chart of the world (DCW), GTOPO3O elevation data, and classified IGBP image format. These data were converted to an image format using GeoSTARTM program, that can be read and processed with the ARViewTM software on the desktop computer. Various themes were produced of the area, including road/transportation layer, drainage, urban/built-up areas, elevation, and administrative boundary layer.
Introduction
In order that global issues may be addressed, an improved understanding of the Earth as a system must be established.The construction of a Global Map is aimed at developing a common world map for the next Millllenium. This world should have the following characteristics, to wit 1) it should cover the land area of the whole world; 2) it should include Geographical information directly connected with environment , such as vegetation and land use ; 3) it should have globally consistent accuracy; and 4) it should be in usable digital form.
This study aims to illustrate what can be done with existing data of the Philippines to provide various map information in a format that confirm with that conform with that of the Global Map. The general objective of this Global Mapping Sample production resides on using existing global geographic digital data, of selected sample areas, for checking data availability, accuracy and reliability.
Methodology
Selection of Sample Areas
The sample areas were selected according to available digital data and paper maps corresponding to existing 1:50.000 map sheets, making possible the final checking.
Sources of Digital and Other Data
Elevation data were sourced primarily from the Global 30 Arc Second Elevation Data Set (GTOPO30). The GTOPO30 is a global digital elevation model (DEM), regularly spaced at 30- arc seconds which produces a grid system with approximately 1-Km interval in longitude. Data are provide in what is termed as titles covering, on average, 50 degrees of latitude by 40 degrees of longitude.
GTOPO30 has been divided in 33. Data for the each tile are provided in a set of 8 files with the extension indicating its contents.
.HDR header file for DEM
.DMW world file
.STX statistics file
.PRJ projection information file
.GIF shaded relief image
.SRC source map
.SCH header file for source map
For the vector GIS data, the Digital Chart of the World (DCW) was used. The DCW is a comprehensive database, composed of global coverage base maps at 1:1.000.000 scale. It consists of geographic, attribute, and textual data that can be accessed, queried, displayed, and modified with ARC/INFOTM and Are ViewTM software. The database was originally developed by SERI in vector Product Format(VPF) for the United State Defense Map Agency (DMA). The primary source for the database is the DMA Operational navigation Chart (ONC) series that are produced by Australia, Canada, the United Kingdom, and the United States(1).
For landcover data, the Global Land Cover Characteristics Database was utilized. The Global Land Cover Characteristic Database has 1-km resolution, for use in a wide range of environmental research and modeling applications. The database is a product of the US Geological Survey (USGS) (EROS Data Center ) , the University of Nebraska-Lincoln (UNL) and the Joint Research Center of the European Commission.
| Data Type | Source/Generator of Data | Scale | Date | Fromat | Projection | Media Type |
| GTOPO30 | U.S Geological Survey EROS Data Center | 30 arc seconds (1 km) resolution | Completed in 1996 | raster(.BIL, 1 channel, 16 bit/pixel) | Geographic(lat/long) | Digital Internet CD-ROM,8mm tape |
| The Digital Chart of the world | ESRI Incorporation Global Coverage GIS Database | 1:1.000.0005 x 5 degrees tiles | 1992/93 | Vector | Geographic(latitude/longitude), decimal degrees | Digital CD-ROMS |
| Global Land cover characteristic Database | USGS | 1 km resolution 94 vegetation classes | 1992/93 | raster image transformed to .TIFF (.TFW file, required to set the geographic location of .TIF image) | Geographic(lat-long) | Digital Internet |
| Philippine Map | National Mapping and resource information Authority Republic of the Philippines | 1:50,000 | 1987 | Paper | Transverse Mercator | Media: Paper |
All data available for global mapping requires intense preparation before being used. In case of DCW , data was already prepared for using with Arc ViewTM. But GTOPO30 and Land Cover Data have to be previously prepared by the GST staff in order to be used in the study . They extracted the sample areas from different files adapting and changing different projections and formats of data . The sample areas ware extracted the different files, adapting and changing different projection and formats of data .
The necessary DCW data ware selected from the 5 x 5 degrees tiles to complete the sample study areas . For this exercise, the sample area references were tile numbers WG12 and WG22 corresponding to the area around Mindanao , Philippines , of the DCW files .
The projection conversion program was accessed through the global land Cover Characterization - Global Read me 7.0 (Geometric characteristics, software for latitude / longitude conversion ) available via the Internet by file transfer protocol (FTP).
All of the image file had the following specification: 5 x 5 degrees means 600 x 600 cells each cell being equal to 30' x 30', and extracted without header. These files were then subsequently converted to .TIFF files in an appropriate image processing software such as the Adobe PhotoshopTM or any similar software like , GeoSTARTM. It is necessary to build an index file for vegetation, and join the pieces to make one file to overly with other vector files.
As mentioned earlier, the available image processing software most appropriate for this conversion is Geo STARTM.
The image files(.TIFF) necessary for the subsequent steps must be constructed, which should include the right header coordinates in order to visualize them . At the file .TWF the coordinates of the upper left corner, or the size of the pixel) can be selected , copied or inputted through a text editor.
It should be noted that the same header must be used for all .TIFF image files since the image layers have the same number of rows and columns, correspondingly, the same longitude and latitude . For these processes the .TFW files for each image tile must be renamed for each image layer , by copying and saving with the same files name of the tile, but with distinctive file extension of .TFW. (e.g. tiles WG12.TIF and WG22.TFW, Respectively). The TFW files contain coordinate information .
The extension of the GTOPO30 image files was previously changed to. DEM, and converted to . TIFF format using the GeoSTARTM program .
For the purpose of the present work , using ArcViewTM the layers selected for each tile were .
| Layer number and name | Coverage name | Attribute table | Annotation |
| 1.Political/ Oceans | PONET POPOINT |
PAT PAT |
YES NO |
| 2.Populated places | PPPOLY PPPOINT |
PAT PAT |
NO YES |
| 3.Railroads | RRLINE | AAT | YES |
| 4.Roads | RDLINE | AAT | YES |
| 6.Drainage | DNNET | AAT | YES |
| 8.Hypsography | HYNET | AAT | NO |
For each theme the choice on the type of feature to work on consisted of : polygon (areas), are (lines) or point , each one with its own attributes.
All the layers and feature necessary were inputted and then edited the legend for each layer ,I .e drainage system , roads network, political boundaries ,vegetation elevation ,etc. Overlaying of data followed . figure 1 present an overall flow of the processes employed in the construction of the Global Map.
Results
The ideal way for checking the sample produced is comparing it digital file of the same or at the same or at a bigger scale . For the purpose of this study, the results were checked with paper maps with 1:50,000 scales , produced by the National Mapping and Resources Information Authority of the Philippines (NAMRIA), in the case of the PHILIPPINES sample area.
References
- DIGITAL CHART OF THE WORLD for use with ARC/INFO software - DATA DICTIONARY . A comprehensive GIS database for use with workstation ARC/INFO and Are View . Environmental Systems Research Institute Inc. Are Data - ESRI, Redlands , USA 1993,.
- GLOBAL MAP AND IT'S SPECIFICATIONS Printed handout ,GSI, Third Geographic Division , Tsukuba , 1998 Also obtainable via GSI homepage .
- Using Are View GIS. The Geographic Information System for Everyone. ESRI , Redlands, USA, 1996.
- GTOPO30 Documentation, available at http://www.gsi-mc.go.jp/gtopo30/readme.html
- GLOBAL LAND COVER CHARACTERISTICS DATABASE , available at
http://edcwww.cr.usgs.gov/landdaac/gicc/globdocl_2.htm.