| GISdevelopment.net ---> AARS ---> ACRS 1998 ---> Land Use |
Detection of L-band Corner
Reflectors in Japanese Residential Environment from JERS-1 SAR Imagery
Takako
Sakurai-Amano1, Shigeki Kobaryashi1, Naoyuki
Fujh2 and Shuhei Okubo3
1Earth Observation Research Center/Nasda
2Research Center for Seismology and Volcanology/Nagoya University
3Earthquake Research Institute/University of Tokyo
Abstract 1Earth Observation Research Center/Nasda
2Research Center for Seismology and Volcanology/Nagoya University
3Earthquake Research Institute/University of Tokyo
Because Japan is a mountainous country where the flat areas are densely populated, the availability of flat, open land that is well suited to the placement of corner reflectors (CRs) is very limited. JERS-1 SAR uses the L-band, which requires a larger CR than the ones used for C-band SAR, which makes it more difficult to receive permission from landowners in Japan. Therefore, relatively small CRs must be placed in small open areas, close to confounding objects. The method used to detect CRs in such less than ideal conditions is described, and applied to existing CRs.
1. Introduction
We at the Earthquake Remote Sensing Frontier Group are in the process of establishing a network of corner reflectors(CRs) in one of our study areas as ground control points (GCPs) to be used to improve orbital information and co-registration for JERS-1 SAR differential inteferometry. However, it is very difficult to find empty, large, and flat areas suited for long-term placement of CRs in Japan because 70% of the country is mountainous and the flat areas are densely populated. It follows that a CR in Japan ends up being placed in a corner of a flat area near human habitation, with confounding objects unavoidably nearby. Also, the JERS-1 SAR uses the L-band, so in order to have the same scattering cross section as a CR for a C-band SAR, each side of the CR must have about twice the length as one for the C-band CR [1]. This translated to four times more area needed, and not only is the CR more expensive, but in Japan, with a high premium on land, it becomes more difficult to receive permission from the landowners. The CR therefore had to be made as small as possible. We have constructed triangular trihedral CRs with isosceles triangle sides 170 cm in length, made of perforated 3-mm thick aluminum sheets. Five CRs have been installed so far as GCPs. The location of the CRs are summarized in table 1.
| Location on Map | Elevation | Description | Installation Data | ||
| Longitude | Latitude | ||||
| Sagara | 138:11:11E | 34:40:27N | 106m | Surrounded by tea plantations | 1997/12 |
| Kakegawa | 138:1.51E | 34:45:32N | 66m | Corner of Parking lot (on top of cliff) | 1997/12 1998(re-inst.) |
| Shimo-uchida | 138:4.57E | 34:43:7N | 14m | Corener of athletic field | 1998/7 |
| Mikura | 137:55:50E | 34:55:16N | 385m | Corner of public space (in mountain) | 1998/7 |
| Hamaoka | 138:8:45E | 34:37:37N | 30m | Corner of athletic field | 1998/7 |
These CRs appear as bright point targets in SAR images, but they do not appear with enough intensity to allow easy recognition. It was therefore necessary to have a high level of visual interpretation skills in order to detect these points. First, most CRs were located in regions that did not have any particular characteristic that distinguished them from the neighboring regions. We used a number of key characteristics as clues in interpreting the images, but positive identification of the sites was still very difficult. Also, even though the CRs were placed in nominally wide open spaces such as athletic fields, open fields, and parking lots, the primary use of the space ruled out placing the CR in the middle of the area away from surrounding objects. Because the orbit of JERS -1 is unstable, the surrounding objects appear very differently in some observations, and the CR could not be identified based solely on its position relative to nearby objects.
The methods used to detect and identify weak point targets such as corner reflectors via visual interpretation are described below. The results of the method applied to existing CRs are also reported.
2.Data
Single-look SAR image observed in 1997 and 198 were processed from a level ) (©MITI/NASDA) JERS-1 SAR scene of Omaezaki (66-242) using Atlantis's EVSARP.
3.CR Detection Procedure
The method used to detect and identify CRs by visual interpretation is outlined below:
- Reduce speckle from the single-look slant-range image using the Enhanced SPF filter[2].
- Resample the image by every other pixel along the azimuth direction to give roughly a 1:1 ratio for the horizontal and vertical scales in slant-rang images, to make comparisons with topographic maps easier. (These images are still farily slanted to compare with topographic maps. For regions where identification of objects is very difficult, it helps to prepare JERS-1 images that have been re-sampled and topographic maps).
- Find the rough location of the target area within the image from the shape of the coastline and the location of large cities and rivers.
- Using a 1:25000 tographical map for comparison, locate and confirm the target area more accurately in reference to key features such as city borders, hills, rivers and roads.
- Estimate the location of the CR within the target area, and compare the full resolution images of the area before and after the installation of the CR, observing where changes occurred. The CR should be among newly appearing sharp point targets.
- Confirm that the CR candidate continues to be observed at the same location in subsequent images.
- Choose several relatively sharp objects within few tens of pixels of the CR candidate point target, and observe any changes in CR position relative to the object to the objects. It there is no change in the relative positions from most of objects, conclude that the CR candidate is indeed the CR. Note that some object may not appear in some observation or even other nearby object may be mistakenly identified as the same objects.
- If the CR still cannot be located, reconfirm the location of the target area. If the area was identified correctly, and the CR still could not be detected, then check the angles of incidence of the CR on site or if there is anything made of steal or iron that disturb the angle measurements around the CR.
4.Case Study
4.1 Easy Detection
CRs surrounded by large dark areas may not be found very easily at first, but once the target areas were positively identified, they were easily detected by comparing several images taken before and after their installation.
Fig.1 shows the CR at Sagara. The CR is located within the circle. The Sagara CR was installed in the middle of a tea plantation, and is over 300 meters away from nearby houses. The tea plantations appear dark in the SAR images. The CR is located right next to a Crustal Movement observatory, but the walls of the observatory are not aligned to the angle of the satellite, and do not appear in the image. Because of this, the CR appears clearly in the image. Figure 2 shows the CR at Shimo-uchida. The CR is also located within the circle. Aside from some scattered villages, the surrounding flat area consists mostly of paddy fields, which appear dark. The athletics field where the CR is installed is located on a new landfill at a delta where two rivers meet. Compared to other athletics fields in Japan, it is very large, and fortunately, equipment and facilities have not yet been installed.
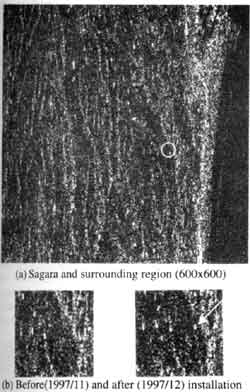
Fig 1. Sagara CR
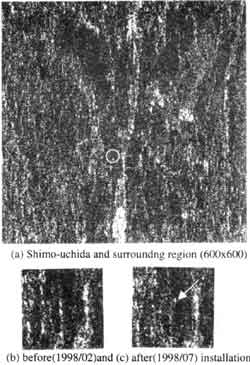
Fig 2. Shimo-uchida CR
4.2 Difficult Detection
Detection and dentification was very difficult for the kakegawa CR because of nearby cliffs and parking lots, for the Hamaoka CR because of a number of objects surrounding the athletics field, and for the Mikura CR because it is located with a mountainous region.
The Kakegawa CR was installed in a small empty lot between the parking lot of the Kakegawa Civic Hospital and a cliff. Kakegawa Civic Hospital was built on land that was reclaimed from a hilly region southeast of Kakegawa City. With a large parking lot and an artificial cliff created from the reclamation on the east side, it forms a very prominent scene in the area. However, it is not a feature that stands out in a SAR image (Fig. 3). First, we searched for the hospital using as landmarks the dark Tomei Highway and Japan Railways line running through the bright city, finding the shaped inter change on the highway, and following that and the cliff, which appears as a somewhat bright line, on the east side of the hospital. The hospital is a large building with walls facing east, so we expected a bihedral corner reflection from the ground and side of the building. But the area appears to be blocked by some low-lying affiliated facilities just above the cliffs, and the building does not stand out in the image. The single strong point target (marked H in small subimage (1998/12) in Fig. 4(a) associated with the hospital is conjectured to come from the air conditioning unit on the rooftop. There is a large Parking lot on the north and west sides of the hospital, but area appears bright or dark depending on whether there are cars parked there or not. In the image taken in may 1998 (Fig.3), the observation data coincided with a holiday, so there were almost no cars, and the parking lot appears dark. The artificial natural cliffs on the east side of the hospital appear on the whole as a somewhat bright line, with occasion bright point targets.
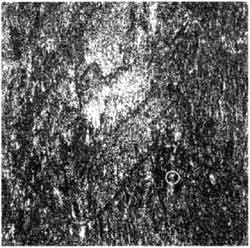
Fig 3. Kakegawa CR and surrounding region
Fig. 4(a) shows a series of 120 x 120 pixel subimages centered approximately on the Kakegawa CR. The appearance of the parking lot and the bright points along the cliffs vary with each image; the area around the after they have been despeckled with the Enhanced SFP filter.
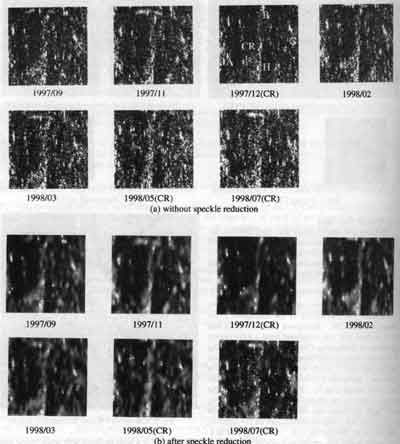
Fig 4. Area around Kakegawa CR.
With speckle reduction, it became significantly easier to locate the CR. Even then, point targets in the area immediately surrounding the CR vary with each observation, so the CR could not be identified and Confirmed just from its relation to the surrounding features. So instead, we checked its position relative to a prominent point target that was further away. The positions of the CR and other prominent targets in the surrounding area relative to the point H on the hospital are summarized in Table 2. The positions of the CR candidate relative to the hospital target on December 1997, May 1998, and July 1998, and in turn the position of other surrounding targets, are practically constant. Based on this result we confirmed that the candidate point target as the Kakegawa CR.
| CR | A | B | C | |
| 1997/09 | NA | (-46, -18) | (-9, -93) | (52.-56 | )
| 1997/11 | NA | (-46, -20) | (-9, -95) | (52.-58) |
| 1997/12 | (2,-28) | (-45, -19) | (-10, -94) | (52.-58) |
| 1997/02 | NA | (-46, -19) | (-9, -93) | (52.-58) |
| 1997/03 | NA | (-46, -18) | (-9, -93) | (52.-56) |
| 1997/05 | (2,-28) | (-45, -20) | (-10, -95) | (52.-59) |
| 1997/07 | (2,-28) | (-45, -19) | (-10, -94) | (52.-57) |
In the case of the Hamaoka CR, shown in Fig, 5 the athletics field is relatively small, surrounded by tall metal framed wire fences, and contains confounding movable equipment such as goals. The field itself could be easily identified from its relation to other nearby objects, since the national highway, drawing a gentle curve nearby, is very visible, and the nearby river also appears clearly in the image. The CR candidate was determined from its relation to surrounding objects, although we have not been able to confirm it as yet because we still have only observation containing the CR.
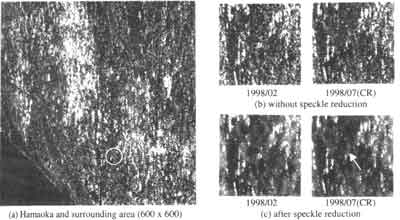
Fig 5. Hamaoka CR
The Mikura CR is located in the corner of a public space in front the public hall next to the shrine in a small hamlet halfway up the side of a mountain. This area, around the southern tip of the Chubu Mountain Range, is located within layers upon layers of mountain ranges that look very similar to each other (see Figure 6), which made the identification of specific regions very difficult. By comparing the vertically compressed image with a topographic map, we very roughly extracted the area shown in Figure 6 as the target area. In a mountainous area like this, creeks, and roads are too thin to act as landmarks. Initially, we tried to locate the target area from the pattern of cluster of point target that may correspond to the scattered hamlets in the region. However, we found that such cluster did not match the location of the hamlets in the map very well. Therefore, we first located the 548 meter Mt. Sanmaru from the shape of the mountains, and then Determined the location of the shrine from the pattern made by scattered hamlets and the shape of the small ridges on the side of mountain. We wee then finally able to detect the CR candidate as a newly appearing point in the area.
Images of the area from before and after the installation of the CR are shown in Fig. 7. We have determined a CR candidate but not yet positively identified the CR, since it was installed this July, and we still have only the July SAR data. Fig. 7 (a) is the single -look image of the area around the CR, and (b) is the image after speckle reduction.
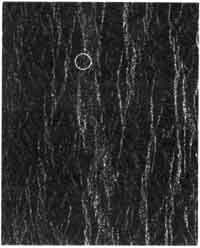
Fig 6. Mikura and surrounding region (800x1000)
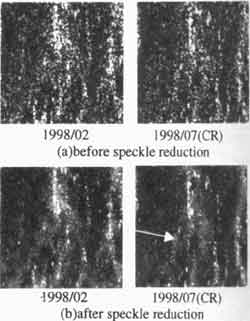
Fig 7. Mikura CR
5. Summary
Japan is mostly mountainous, and the flat area have very little open space, se we are forced to place small corner reflectors in areas surrounded by confounding objects. We have described the methods used to visually detect and identify L-band CRs from SAR images in such circumstances.
6. References
- G.T. Ruck, D.E. Barrick, W.D. Stuar, and C.K. Krichbaum, "Radar Cross Section Handbook", Section 8.22 : Radar Reflectors, Plenum Press, NY-London, 1970.
- T. Sakuari-Amano, and J. Iisaka, "Speckle Reduction for Automatic Detection f Small Features, manuscript in preparation.