| GISdevelopment.net ---> AARS ---> ACRS 1998 ---> Land Use |
Land Use Planning to Avert
the Migration Oriented Watershed Degradation
Sah, Bhuwneshwar Prasad and
Shimizu, Eihan
Regional Planning & Surveying Laboroatroy/Department of Civil engineering
The University of Tokyo, Bunkyo-ku Hongo, Tokyo 113, Japan
Tel.: +81-3-3812221111 Ext. 6129, Fax 81-3-56897290
E-mail:sah@planner.t.u-tokyo.ac.jp, shimizu@planner.t.u.-tokyo.ac.jp
Abstract Regional Planning & Surveying Laboroatroy/Department of Civil engineering
The University of Tokyo, Bunkyo-ku Hongo, Tokyo 113, Japan
Tel.: +81-3-3812221111 Ext. 6129, Fax 81-3-56897290
E-mail:sah@planner.t.u-tokyo.ac.jp, shimizu@planner.t.u.-tokyo.ac.jp
Like in other developing countries, Nepal is also suffering from severe watershed degradation. In Nepalese contest, its main reason is population pressure due to higher population growth rate and in-migration. The fertile valley of Trijuga River in the Udapur district of Eastern Nepal is on example of such phenomenon where about 48 percent of household has migrated-in during last 15 years and most of them have encroached the forestland enhancing soil erosion. Under this context, the present study has been carried out to approach for better land use plan by developing five possible scenarios. The result has shown that 50% reduction in soil erosion. Under this context, the present study has been carried out to approach for better land use plan by developing five possible scenarios. The result has shown that 50% reduction in soil erosion. rate can be achieved by readjusting the land use and reallocation of some household. The land use definition, with clear and strong institutional support, is desirable here.
1.Introduction
Degradation of watershed is a common phenomenon around the world. There are several reasons for such degradation, but most important is improper utilization of watershed resources without any the degradation is generally defined in terms of forest loss and increase in soil erosion rate (DSCWM, 1983). The population pressure, which is resulted from higher rate of population growth (2.25 percent per year, CBS 1994A) and internal migration, for arable land is tremendously high in Terai and valley of mountain area. Forest encroachment, especially in slope, acts double role, that is forest loss followed enhanced soil erosion.
During last few years, flow of migration of people from hilly area to Terai and fertile valley has remained very high. This is, basically, due to the improvement of accessibility and flow of information. Lack of institutional capabilities and suitable land use plan with ample definition of land use encourages the migratory people to encroach in forest on their will. The Trijuga watershed of Eastern Nepal is one good example of such phenomenon. Estimating migration rate through survey, Sah 91996) has reported that 48 percentage of household has been migrated-in during the period of 15 years (between 1975 to 1990) and most of them have encroached in the forestland . This migration and faulty land use has resulted in decrease in forest by 7.35 percent and increase in soil erosion by 44 percent.
Although, there might be other approaches to mitigate the watershed degradation, land use planning approach has been adapted in this study. The objection were:
- Prapare different scenario by using land use/cover, soil erosion rate, shope gradient and population of the watershed.
- Propose land use plan with desirable/sustainable soil erosion rate.
The study area, Trijuga watershed, lies in Udapur district in the eastern Nepal. It is located between 26o 42' and 26o 59'N latitude and 86o 33' 46" and 86o 59' 48" E longitude. Trijuga, the main river of watershed, drains in to the Koshi River and comprises of several rivulets and rivers due to ruggee topography in the area. Total area of the watershed is 732 sq. km and altitude varies from 75 to 1942 meters. The climate varies from tropical in low-tying valley to sub-tropical in the higher elevation. The average annual rainfall and temperature is 1942 mm and 20oC (WEC, 1982), respectively. More than 70 percent rainfall is concentrated from May to October. Forest cover is nearly 58 percent which is dominated by tropical Sal (Shorea robustra) followed by agriculture in 24 percent area in past, the watershed was dominated by indigenous ethnic people, Tharu, but now dominated by migratory people from other parts of Nepal, especially from eastern hill and mountain Area. Agriculture is main source of income and livelihood of the people.
3. Methodology:
Land use change, soil erosion rate and migration data that estimated by Sah (1996) were used as input for this study. The land use change was derived by comparing the old land use map of 1978 extracted from air photograph, with the land use map of 1991 extracted from Landsat TM. The soil erosion rate was estimated by employing University soil, Los Equation (USLE) model. (Schwab et al. 1993). Similary, houselold survey was conducted for the estimation of migration.
The frend of land use and soil erosion rate change for the period of 13 years (from 1978 to 1991) were interpreted and evaluated by considering the permissible limit for the sustainable use of watershed resources. For this, two crucial factors, viz., upper permissible limit of soil erosion rate 910 to 20 t/ha/yr.) and upper limit of slope for cultivation (20 to 30 percent) were taken into consideration. These are exclusively considered as most important while talking about sustainability of land use (Huang & Wu, 1995, DSCWM/HMG, 1992, Schertz, 1993, Williams et al., 1993, Sharma, 1981). The existing in -migration rate, distribution of population and agricultural land, and suitable land for agriculture of the watershed were reexamined. Based on the evaluation of these factors, the desirable land use was simulated with following five scenarios:
- Converting Shrubs into Forestland.
- Converting Degraded Forest into Forestland.
- Converting shrubs and Degraded Forest beyond 20 percent slope in a Forestland.
- Restricting the Agriculture below 20 percent of slope. The Agriculture Land above 20 percent of slope will be converted in to Forest and equivalent of those lands will be substituted from Degraded Forest land of below 5 percent slope.
- Combination of (iii) and (iv)
Finally, the better and use plan for sustainable use of watershed was taken and recommended for the planner policy markers. The overall methodology has been shown in Figure 1.
4. Data Used:
- Satellite data: Landsat TM path/row 140041, acquired on 21 Dec. 1991.
- Aerial photograph: Scale 1:50,000, Nov., 1978.
- Reconnaissance maps: Topographic map: 1:25,000, 1995, Land use map: 1:50,000, 1982, Land System map: 1:50,000, 1994, and Political map: 1:250,000
5.1 The Watershed Degradation and Present Situation:
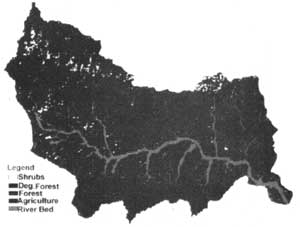
As shown in Table 1, during the period of 13 years (between 1978 to 1991), the forest area has decreased from 65.21% to 57.86%, that is, rate of forest destruction remained 0.57% per year. Similarly, during the same period, rate of soil erosion has increased from 12 t/ha/yr. To 18 t/ha/yr. In 1991 (Table 1). Thus neither the forest area could be maintained nor the rate of soil erosion has remained constant. The distribution of land use and soil erosion rate of year 1991 is shown in Map 1 and 2 respectively.
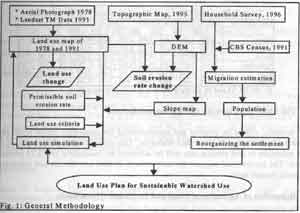
Table 1: Land USE/Cover and soil Erosion Rate of Trijuga Watershed
| Land cover | year | Land Use Change 1978-91(%) | Ave. soil loss (t/ha/yr) | %Contribution to soil loss | |||
| 1978 (%) | 19991 (%) | 1978 | 1991 | 1978 | 1991 | ||
| Shrube | 2.27 | 3.45 | 1.18 | 123.36 | 180.24 | 22.47 | 34.61 |
| Degraded forest | 4.19 | 8.90 | 4.71 | 10.96 | 10.53 | 3.68 | 5.21 |
| Forest | 65.21 | 57.86 | -7.35 | 1.72 | 1.85 | 8.99 | 5.96 |
| Agriculture | 22.49 | 23.66 | 1.17 | 35.99 | 41.20 | 64.86 | 54.21 |
| River | 5.84 | 6.14 | 0.30 | 0.00 | 0.00 | 0.00 | 0.00 |
| Total | 100 | 100 | 0.00 | 12.48 | 17.98 | 100.00 | 100.00 |
Degraded forest < 40% & Forest=> 40% canopy cover
Forestloss = 7.35%/13 years =0.57 % per year
Soil loss increment (17978.91)=(17.98-12.48)/12.48*100 =44%
5.2 The Result of simulating Land Use/Cover:
Change in land use pattern has resulted lower rate of soil erosion than existing one in all of the scenarios, but the variation differs considerably (Table 2). The 2nd Scenario is the worst as it has Reduced less than one t/ha/yr. Soil erosion rate even after converting 8.90% of degraded forest to forest. All other scenarios gave, more or less, considerably reduced rate of soil erosion . It we consider the higher rate of soil erosion from agriculture land, which is matter or concern is at impact is immediate, 4th and 5th scenarios are desirable.
The 5th seems more reasonable and feasible considering that agriculture includes crop cultivation along with livestock rearing. Over-utilization/overgrazing of Forestland, by the farming community, results in to Degraded Forest first and then in Shrubs. Thus, once agriculture of the area is removed, conversion of Shrubs and Degraded Forest Land in to Forest land in to forestland is easier. It also limits the agriculture land below 20 percentage slope. If this option is adapted, 5.23 percent of total land area should be re-planned. This work will include plantation of forest trees in the part of shrub land, degraded forest and agricultural land along with conversion of around 0.67 percentage degraded forest in to agricultural land. The distribution of land use and soil erosion rate of land use simulation with 5th scenario is shown in Map 3 and 4 respectively.
| Land use/cover |
Area (%) in Different Scenario | Ave. Soil Erosion Rate t/ha/yr.) | ||||||||
| S1 | S2 | S3 | S4 | S5 | S1 | S2 | S3 | S4 | S5 | |
| Shrubs | 0.00 | 3.45 | 1.90 | 3.45 | 1.90 | 0.00 | 180.29 | 81.28 | 180.29 | 81.28 |
| Degraded forest |
8.90 | 0.00 | 6.57 | 8.22 | 5.89 | 10.53 | 0.00 | 5.13 | 10.53 | 5.13 |
| Forest | 61.32 | 66.77 | 61.74 | 58.54 | 62.42 | 2.05 | 2.07 | 2.28 | 1.94 | 2.35 |
| Agriculture | 23.65 | 23.65 | 23.65 | 23.65 | 23.65 | 41.23 | 41.23 | 41.23 | 27.05 | 27.05 |
| River | 6.14 | 6.14 | 6.14 | 6.14 | 6.14 | 0.00 | 0.00 | 0.00 | 0.00 | 0.00 |
| Total | 100 | 100 | 100 | 100 | 100 | 11.9 | 17.36 | 13.04 | 14.51 | 9.56 |
| S1,S2,S3,S4 and S5 are the Scenario 1,2,3,4 and 5 respectively | ||||||||||
6. The Land Use Planning and Recommendations: The 5th scenario should be adapted and recommended for immediate action while considering the sustainable utilization of watershed resources. This option is most convincing, as almost 50 percent reduction in soil erosion rate will be achieved by readjusting just 5.23 percent of total land area. The institutional support for enforcement of land use criteria and restriction are the most crucial factors here.
6.1 Relocation of Agricultural Land and Its Owner (Household):
The area of agricultural land above 20 percent of slope is 4.94 square km. (0.67 % of total land area). This land should be planted with forest tree and substituted with equivalent land area from degraded forest of below 5 percent slope.
The total household (HH) of the study area is 18004 (CBS, 1994b). Average land holding per HH of the study area is 1.27 ha, while it is just 0.86 ha in the hilly area (Sah, 1996). Agriculture land which is supposed to be replaced with forest tree, lies in hilly area. Thus number of household which should be relocated, can be calculated as:
No. of HH (Considered for relocation)= 4.94 sq. km/0.86 ha. = 575
Thus, percent of HH to be relocated = 575/18004 = 3.20 percent
As 48 percent of HH of the study area were in-migrated from outside watershed area, internal migration of 575 HH (3.20%) is very small and manageable.
6.2 Forest Plantation and Development Works:
All together 4.56 percent area should be planted with forest species. Breakdown of the plantation area is given in Table 3. For settlement of the migrated (relocated HH) people, from higher to lower slope land, 0.67 percent (4.94 sq. km. Area) of the secondary forest should be cleared for cultivation purpose.
| Land use/cover | Area (Percent) | ||
| Present (1991) | Scenario5 (S5) | Difference | |
| Shrubs | 3.45 | 1.90 | -1.55 |
| Degraded forest | 8.90 | 5.89 | -3.01 |
| Forest | 57.86 | 62.42 | 4.56 |
| Agriculture | 23.65 | 23.65 | 0.00 |
| River | 6.14 | 6.14 | 0.00 |
| Total | 100.00 | 100.00 | 0.00 |
Suitable activities for agricultural (Crop and Livestock) production enhancement, socioeconomic and demographic factor improvement and awareness should be lunched. Additional soil and forest conservation measures are also desirable.
7. Conclusion
The methodology presented here is simple, but it is more appropriate to control watershed degradation. Forest plantation is required only in 4.56 percent of total area to reduce soil erosion rate by 50 percent that is from 17.98 to 9.56 t/ha/yr. This will require the reallocation of 0.67 percent agricultural land and 575 Household, that is 3.2 percent of total Household. The relocation of such as small household number is feasible while considering the 48 percent of in-migration in the watershed area during last 15 years.
8. Reference:
- Central Bureau of Statistics, CBS 91994a), Population of Nepal by District & Village Development Committee/Municipalities (Population Census, 1991), National Planning commission Secretariat, HMG, Nepal
- Central Bureau of Statistics, CBS *1994b), Statistical year book of Nepal, National Planning commission Secretariat, HMG, Nepal
- DSCWM 91983), Watershed conditions of the Districts of Nepal, Department of Soil Conservation and Watershed Management, Kathmandu
- DSCWM/HMG, Nepal, (1992), Soil conservation and Watershed management Operation Plan for Subwatersheds of Palpa District, DSCWM/HMG, Nepal.
- FAO (1995), tropical Forestry Action Plan, Committee on Forest Developmnet in the Tropics, FAO, UN, Rome
- Huang, C.T. and C.C.Wu 91995), Farmland Planning: A Practical Approach, Report of an APO Seminar on Soil Conservation and Watershed Protection in Asia and The pacific: 1993, Asian Productivity Organization, Tokyo.
- Sah, B.P. 91996), Assessment of Watershed Degradation and its Socioeconomic Impacts Using Remore Sensing and GIS : A Case Study of Trijuga Watershed, Nepal, AIT Thesis No. SR-96-20.
- Sah, B.P. Honda, K and S. Murai (1997), Land Degradation and Socioeconmic Modeling by Using Remote Sensing and GIS for Watershed management, Asian-Pacific Remote Sensing Journal, Vol. 9,No.2.
- Schertz, D.L. (1993), The Basis for Soil Loss Tolerances, Journal of Soil & Water Conservation, Vol.38, No.1.
- Schwab, G.O., Fangmeier, D.D. Elliot, W.J. and R.K. Frevert 91993), Soil and Water Conservation Engineering, 4th Edition, John wiley & sons, Inc., NY
- Sharma, C.K. (1981), Landslide and soil erosion in Nepal 2nd Edition, Navana printing works private Ltd., Calcutta
- WEC (1982), Hydrological Studies of Nepal, Vol 1 & WEC, Water and Energy Commission, Ministry of water Resource, HMG, Nepal
- Williams, J.R., Renard, K.G. and P.T. Dyke 91993), EPIC A New Method for Assessing Erosion's Effect on Soil Productivity, Journal of Soil & Water Conservation, Vol. 38, No.5.
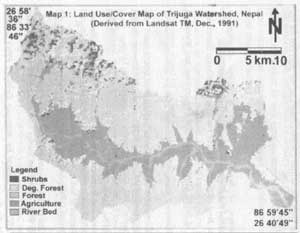
Map 1: Land Use/Cover Map of Trijuga Watershed, Nepal (Derived from Landsat TM, Dec., 1991)

Map 2: Soil Erosion Map of Trijuga Watershed, Nepal: 1991
Map 3: Simulated (Scenario-5) Land Use/Cover Map of Trijuga Watershed, Nepal
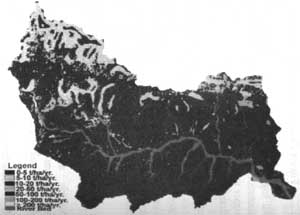
Map 4: Simulated (Scenario-5) Soil Erosion Map of Trijuga Watershed, Nepal