| GISdevelopment.net ---> AARS ---> ACRS 1998 ---> Land Use |
Polarimetric Radar Data
Analysis of Key Landcover Features in the Coastal Panay Area: A
Preparatory Tool for Polarimetric SAR Image classification
Enrico C. Paringit,
Epifanio D.Lopez, Florence A. Galeon and Randy Joh N. Vinluan
Training Center for applied Geodesy and Photogrammetry
University of the Philippines
Diliman, Quezon City, 1101 The Philippines
Tel no. (632) 920-5301 to 99 to loc. 5534,
Fax No. (663) 992-4174
E-mail: ecp@engg.Upd.edu.ph, edl@engg.upd.edu.ph
AbstractTraining Center for applied Geodesy and Photogrammetry
University of the Philippines
Diliman, Quezon City, 1101 The Philippines
Tel no. (632) 920-5301 to 99 to loc. 5534,
Fax No. (663) 992-4174
E-mail: ecp@engg.Upd.edu.ph, edl@engg.upd.edu.ph
In this paper, we examine the usefulness of polarization signature analysis as a preparatory implement in performing a fully polarimetric image classification of radar imagery, specifically for JPL/NASA airborne synthetic aperture radar (AirSAR). This is accomplished by identifying probable scattering mechanisms for each pixel in the SAR data and applying this technique for discrimination and characterization of selected landcover features in a coastal zone. Training areas containing various coastal land features of the panay-Guimaras Strait were first isolated and computed for basic image statistics indicators. Go-and cross polarization signatures of these images computed from the original Stokes's matrix format of AirSAR were then plotted at different wavelengths. Preliminary results from the quantitative analysis and graphical examination of the plots reveal significant differences in polarization signatures among selected landcover types that can further aid in discriminating between land cover types. Notable statistical resemblance of radar backscatter coefficient values between some landcover types is common. Differences in the polarization signatures between samples of the same class of landcover were also observed.
1.Introduction
Studies of coastal zone characteristics and processes have drawn wide and varied attention over the years due to fact that the majority of the earth's inhabitants live along shorelines. In conjunction, remote sensing technology has been regarded as a significant tool in monitoring the effects of natural and man-made activities and their changes to the coastal environment. In particular, the use of synthetic aperture radar (SAR) earth observation systems, with its synoptic coverage is regarded as having high potential in providing a reliable means of monitoring the tropical coastal areas because of its virtual weather-independent, day/night imaging capabilities.
Polarimetric SAR data, such as that acquired and processed by NASA/JPL AirSAR system, give more information about ground targets than single channel SAR data (Basili, et, al, 1997) mainly because of its ability to capture radar polarization signature, allowing stronger inference of the physical scattering process than single-polarization measurements through identification and characterization of dominant scattering mechanism (Evans, et. Al. 1987,; Zebker et. Al, 1987). This study sought to provide substantial
Coastal zone information from AIRSAR imagery in a methodical manner. Specific, it aims to identify land and sea surface characteristics along the Panay-Guimaras Starait by means of developing and applying tools to analyze polarimetric SAR data. It is expected that a polarimetric multifrequency approach can very well overcome difficulties in land cover discrimination brought about by the differences in spatial extent and irregularity in shape common in coastal areas where standard region-based approaches do not perform well.
2. The Study Area
The coastal Panay area is located in the Western Visayas region with geographic coordinates centered at 10o43' N, 122o24'E, about 250 miles south-southwest of Manila. It is composed of extensive mudflats most of which have been structured into fishponds. Inland areas area covered by vast tracts of cultivation zones planted mainly with rice and lined up by settlements on the verge of urbanization. Brisk economic activities take place I this area owing to its strategic location, with the Guimaras-Iioilo Strait serving as a busy sea thoroughfare for vessels plying domestic routes. The capital city of Iioilo and its neighboring municipalities experience rapid developments and consequently bring stress to its fragile coastal environment, requiring better method to monitor its changes, including land cover.
3. Material and Methods
the NASA-JPL DC-8 aircraft flew over the Coastal Panay area on November 28, 1996 and acquired multiband, multipolarization (C-,L-and P-bands, with full polarization) data. The AirSAR data, stored stored in Stokes' Matrix format, was synthesized to extract three transmit/receive polarization imageries (HH, VV and HV) with nominal resolution of 10 meters. Routine slant-to-ground range correction was applied for the polarimetric radar data and a Lee filter was implemented to suppress speckle.
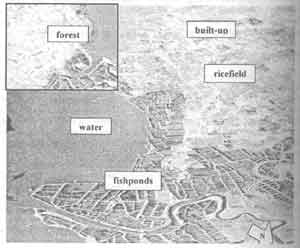
Figure 1. A subset of the AIRSAR multiband-multipolarization data.(RGB: C-VV, L-VV, P-VV) acquired in the coast of Iloilo city, panay Island where landcover samples were taken. Inset AirSAR image is found on the adjacent Guimaras Island which is thickly vegetated.
Different sample images each representing one of five major land cover types were then taken for analysis very much similar to the preparatory procedures done for training areas in supervised classification of optical imagery. First-order statistical measures (mean, standard deviations, etc) were extracted for each test region and plotted (See Figure 2).
Polarization signatures were then plotted to model surface backscattering for each of the selected regions of interest in the images, presumably belonging to specific land cover types. Both co-and cross-polarized signatures were computed for and generated directly from the AirSAR compressed stockes matrix files. Each signature has 91 samples (-45 to 45 degrees ellipticity angle) and 181 lines (0 to 180 degree orientation angle). Details of wave polarization genearation can be described further by the works of van Zyl et.al. (19987) and Zebker (1997).
These signatures, taken together with the computation of the coefficient of variation which is defined as the ratio of the minimum received power to the maximum received power (Zebker, 1987) represent a more complete description of the polarimetric scattering properties of surface as shown in the following.
Results and Discussion
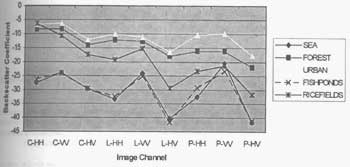
Figure 2. Comparison of mean backscatter coefficients among different landcover types taken from the sample areas. The cross-polarized L-band seem to possess the least backscatter value among all of the signals followed subsequently by all of the cross-polarized.
Figure 2 alone indicates strong correlation between backscatter coefficient values for seawater and the fishponds. It is also evident that both bodies of water have relatively smaller backscatter values due to the tendency of their surfaces to act as specular reflectors, returning electromagnetic waves away in a direction opposite to incidence wave. Higher backscatter coefficient values for the urban areas are likewise observed possibly because of a double bounce scattering mechanism which building, houses and other similar structures commonly found in built-up areas, acting as corner reflectors, exhibit. On the other hand, backscattering from forests appears to have two main components: one is a two bounce corner reflector mechanism and the other is a diffuse component which can be attributed to multiple scattering behaviour.
Figure 2. Comparison of mean backscatter coefficients among different landcover types taken from the sample areas. The cross-polarized L-band seem to possess the least backscatter value among all of the signals followed subsequently by all of the cross-polarized.
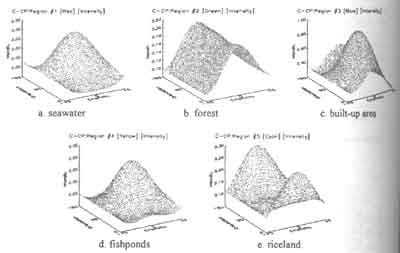
Figure 3. Different Polarization signatures for five different landcover types all plotted in co-polarized C-band.
Sample regions taken from the build-up areas have different co-polarization signatures shapes for the three bands. The L-band polarization signature of the urban areas demonstrates a non conforming cross-polarized signature, i.e. it did not represent the predicted reversal of its co-polarized counterpart which is common for the other landcover types.
As expected, the fishponds exhibited a co-polarization signature shape similar with of the seawater. This is a result which reinforce early results from the mean value plots of the training areas. There were however discernable difference in the cross-polarization plots of fishponds most prominent in the C-band. This can be attributed to the influence of sea winds on surface water where wave heights up to twentieth of a meter can be observed due to the seasonal winds at the time of observation.
Among the land cove types being described, the forested areas, which display a multiple scattering mechanism, has the highest coefficient of variation indication diversity in the scattering mechanism within the sampled area.
5. Summary and conclusion
Two methods to analyze AirSAR data were developed for this study. One technique is by computing for the ordinary statistical indicators and relate them to the backscattering responses of targets. The second method involves plotting the plarimetric signatures for the different landcover types, examining the plots visually and relating these to the coefficients of variation of the signatures. The comparison of the C,L and P-band SAR images in terms of their scattering responses and polarization signatures increase understanding of land cover polarimetric characterization and serve as a useful input for land cover discrimination. It is recommended that further research is needed mathematically relate the characterization of the polarization signatures to their respective landcover types to yield meaningful results when performing SAR image classification.
Acknowledgement
The authors wish to acknowledge the kind support of the Philippine Government, particularly the Philippine council for Advanced Science and Technology Research and Development of the Department of Science and Technology for making the acquisition of the polarimetric radar data possible through the Philippines -NASA AIRSAR Project and for generously funding the research.
Reference:
- Basili, P,P. ciotti, G.D Auria, F.S. marzano, N. Pierdicca and P. Quarto (1996), "Assessment of polarimetric features of discriminate land cover from the MAESTRO I campaign" International Journal of Remote Sensing, 15(4), pp. 2887 -2899.
- Evans, Diane L., Tom G. Farrr, jakob J. Van Zyl and oward A. Zebker, (1988) " Radar Polarimetry: Analysis Tools and applications" IEEE Transactions on Geosciences and Remote Sensing, 26(6), pp. 774-789.
- Van Zyl, Jakob. J., Howard. A. Zebker, and c. Elachi, (1987) "Imaging radar polarization signatures: Theory and Observation, "Radio Science, 22(4), pp. 529-543.
- Yun Shao, Lin Hao, Lu Xinqiao, Gu Huadong (1997), "Effect of Frequency and Polarization of SAR system on Target Detection", Proceeding of the Chinese conference on Remote Sensing, Beijing, China, pp. 418-426.
- Zebker, Howard A., Jakob J. van Zyl, and Daniel N. Held (1997), "Imaging Radar Polarimeter from Wave Synthesis", Journal of Geophysical Research, 92(B1), pp. 638-710.