| GISdevelopment.net ---> AARS ---> ACRS 1998 ---> GIS |
Application of Remote sensing
and GIS for Road (Asian Highway) Network Database creation and Risk
Assessment
Manzul Kumar Hazarike, Lal
Samarakoon, Honda Kiyoshi
Asian Center for Remote Sensing (ACRoRS)
Space Technology Applications and Research Program
Asian Institute of Technology
P.O. Box 4, Klong Luang , pathumthani 12120, Thailand
Tel:+66-2-524-5580 Fax :+66-2-524-6147
E-mail: manzul@ait.ac.th
Abstract Asian Center for Remote Sensing (ACRoRS)
Space Technology Applications and Research Program
Asian Institute of Technology
P.O. Box 4, Klong Luang , pathumthani 12120, Thailand
Tel:+66-2-524-5580 Fax :+66-2-524-6147
E-mail: manzul@ait.ac.th
Road network promotes economic development of a country through trade and tourism development. Status of road network in most of Asian countries in terms of their condition as well as connection to neighboring countries is very poor at present. Asian Highways project has been initiated by UN-ESCAP to promo mote and coordinate the development of international road transport as a means to contribute to he expansion of national and international trade and tourism , to stimulate economic growth and to facilitate cultural growth among he Asian countries.
A database on road networks such as existing spatial distribution of roads and their possible links to the roads of neighboring countries has been created and updated using Remote Sensing and GIS . GIS provides a versatile platform for creating an accurate and cost effective database. The information currently available for the road network varies in scales and projection from country to country of t region . Therefore, GIS provides an appropriate environment for integrating such a diversified information . Multi-temporal satellite data are used for updating this GIS database.
The GIS database created for the study are contains information available in existing maps. Since the most of the maps in Thailand were revised in early nineties, therefore, newly constructed roads do not exist in these maps. An updated database has been created using satellite data and field visits. Information such as contours form topographic maps is also incorporated in the database.
The database created in the study is used for landslide risk assessment along the road. Many portions the Asian Highways is passing through undulating terrain with steep slopes and landslide are very common in these areas. There is also a high probability of slope failure due to road construction work. A landslide is a complex phenomenon, therefore, a wide range of ancillary data such as geological, topographic etc. are acquired from existing maps and incorporated into the database. A slope stability analysis in the study area has been carried out and alternative routes are suggested in highly susceptible locations.
1. introduction
the Asian Highway project was first proposed in 1959 (UN-ESCAP, 1997) with a road network covering 65,000 km in 15 member countries . at present there are 18 member countries and 7 republics form former USSR have also joined in the project comprising a road of 90,000 km which include both international and sub-regional routes . it is agreed that emphasis will be given to use the existing infrastructures while developing the Asian Highway. Efforts are also made to connect major cities while finalizing the routes of the Asian Highway. The condition of roads varies substantially form country to country and improvement measures need to be considered in individual basis to meet the requirement of international standard . updated maps dn present condition of roads are not available in may countries of the Asian countries . the conventional way of capturing spatial data is not only tedious, but also time consuming. . however, updating of road information using satellite data is a very cost effective an efficient . wit the advancement of space technology, currently high-resolution satellite data are available for monitoring the road conditions.
2. Study Area
the study are is in Chiangmai province of Northern Thailand and it is extended from 980 45' to 99008' in the east and 18045' to 19009' in the north. Figure 1 shows the study area.
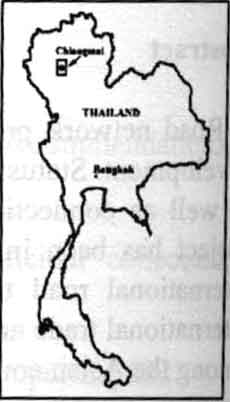
Figure 1: Location Map
3. Methodology
3.1 data Processing
Satellite data were corrected geometrically using Ground Control Points (GCP) taken form topographic maps including road crossing, buildings and bridges etc. thirty GCPs were selected for this propose . A first order polynomial transformation equation was applied to rectify the data set. Road maps were digitized carefully from the topographic maps. Similarly, separate GIS layers or major rivers and contours at he interval for 20m digitized .
3.2 Post Processing
Digitization error like node errors were corrected for each of the GIS layers. Since each or the topographic maps was digitized individually, the arcs were not properly connected in the adjoining maps. I order to remove the is kind of error, edge matching was performed for each of the map sheets.
3.3 Updating Map Information
The digitized layers were overlaid with the geo-coded imagery. Survey for the topographic maps were conducted in 1969, however some maps were updated in 1990's . there are many more newly constructed road in all over Thailand, which are clearly visible in the satellite image. Figure 2 shows procedure of map updating .
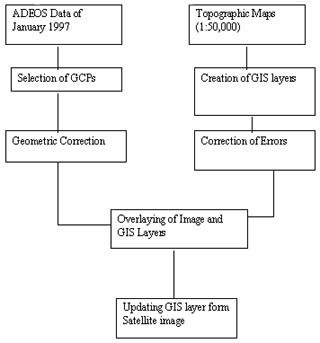
Figure 2: Flow chart of updating map information
The layers are updated according to image interpretation on a monitored. Some of the GIS layers are to exactly matching in the image due to the errors committed while digitizing. Keeping the satellite image in the background GIS layers are corrected wherever necessary. Figure 3a sows the deviation from actual road while overlaying with the digitized road network whereas figure 3 b shows the map after correction.
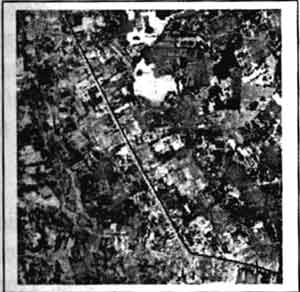
Figure 3a: Overlay with errors
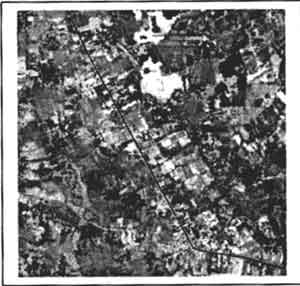
Figure 3b: Corrected Map
Missing roads, which are not available in the topographic maps, have been updated room the satellite image. Looking at the condition form the satellite image, roads are categorized into three groups. Roads comprising 3 pixels or more are categorized as wide, roads with 2 to 3 pixels are categorized as medium and roads with 1-2 pixels are categorized as narrow. Figure 4 shows the different categories of roads .
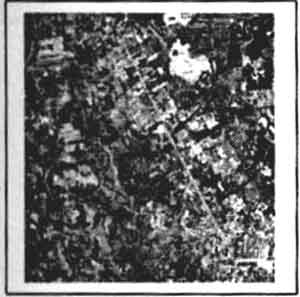
Figure 4a: Wide Road
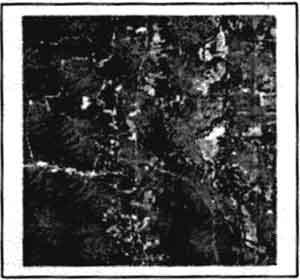
Figure 4b: Medium Road
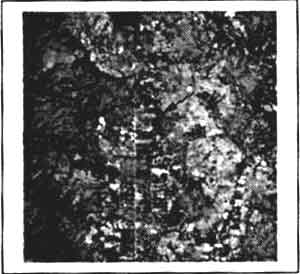
Figure 4c: Narrow Road
3.4 Database for River Crossings
for each of the major roads, the number of bridges exists in rivers and streams crossing have been identifies using topographic maps and field visits. Location of each of the bridges is recorded in the kinematic GPS. A database for the bridges has been created.
3.5 Slope Stability Analysis
The slope stability is analysis is done using fundamental engineering principles. safety factor is calculated room the ration of driving moment to resistance moment. Slopping areas are divided into number f slices by conversing into raster format for ease of calculation
Fellinious method has been used to calculate slope stability. The factor of safety is calculated using he following relationship
N=R(CL+tanF W cosa) (2)
Where T= Driving moment, N=Resisting moment, R=Radius of critical circle, W=Weight of each slice , a=Angle between horizontal axis and the base of slice, L= Length of base slice, C=Cohesion and j= Angle of shearing resistance.
The factor of safety is determined for the following relationship.
From the topographic map, the contours are digitized at the interval of 20 meter and a Digital Elevation Model (DEM) is created with grid size of 20m. a slope aspect map is produced from the DEM. Steepest slope direction for each for the pixel is extracted comparing the surrounding pixels and the profile is drawn. Geo-technical data such as angle of shear resistance and cohesion are used as input for an algorithm to generate a road risk map for the study area.
For determining an alternative route for the highways in most vulnerable locations, a weighted distance function has been used. This function calculated the shortest weighted distance or accumulated travel cost from each cell to nearest cell n a grid. from the accumulated travel cost, a least cost path route can be derived to any destination cell in a grid.
The grid where accumulated distance function is applied contains cell value depending o safety factor and slope. Higher value is assigned to the cells with high slope failure risk and high slope. Figure 5 shows the complete methodology for creating the road network database and risk assessment.
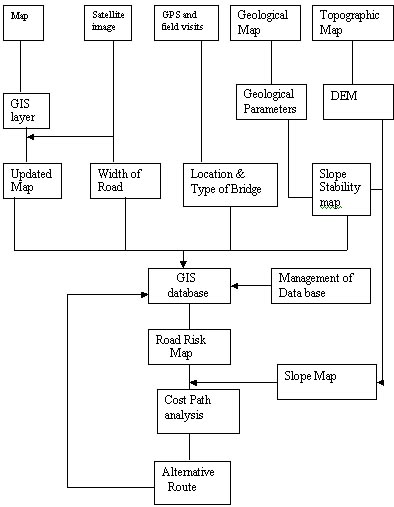
Figure 5: Flow chart showing the complete methodology
5. Result and Discussion
Road network database can be updated very easily using satellite images . while creating an updated vector database for road, river or contour lines, errors are unavoidable while digitizing , keeping precisely corrected image in the background this kind of errors can be rectified. The new roads that are not available in the topographic maps cab be detected in the satellite image. The approximate road width can also be determined from the images. The highway considered in the study has 22 km length with wide croo-section , 15 km length with medium cross- section and 11 km in length with narrow cross-section as shown in figure 7. There are 13 numbers of rovers or streams crossings with bridges and culverts.
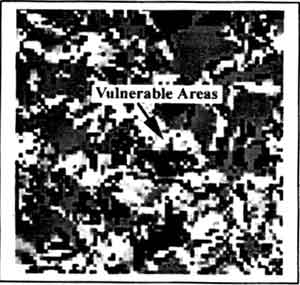
Figure 6a: Vulnerable (Fright) Areas
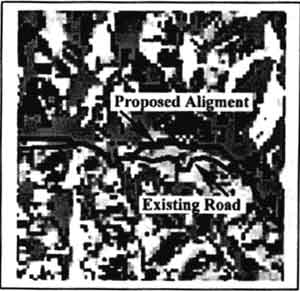
Figure 6b: New Alignment
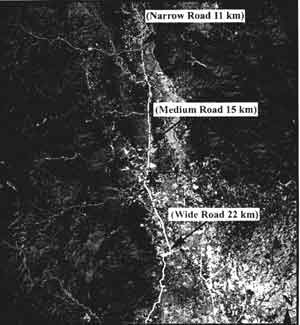
Figure 7: Type of Roads
As far as road stability is concerned, the road network in the study area shows high stability in flat areas. Figure 6a is a slope failure risk map where bright areas represent high risk of slope failure. An alternative route has been determined for the portion of road as shown in the fig 6 b where high risk is involved .
5. conclusions
Information exits in maps become outdated quickly, particularly I countries where the rate of infrastructure development is very high . satellite images provides an opportunity it update maps at an affordable cost. Using satellite images , road information can be updated and approximate with of a road can be determined.
The stability of slope along the road can also be determined using GIS which is very vital form construction point of view. If a particular section of road is very vulnerable , then and alternative route can be suggested.
The stability of slope along the road cab also be determined using GIS which is very vital form construction point of view . if a particular section of road is very vulnerable, then and alternative route cab be suggested.
6. References
- Topographic Maps (1:50,000), Royal Thai Survey Department, Bangkok, Thailand
- UN-ESCAP, 1997 , Asian Highway Format and Development for the Asian Highway Database, United Nations , New York.