| GISdevelopment.net ---> AARS ---> ACRS 1998 ---> GIS |
Monitoring and Analysis of
Deforestation Process using Satellite Imagery and GIS (Case Study in
Myanmar)
Ko Ko Lwin, Ryosuke,
Ryosuke Shibasaki
Center for Spatial Information Science, University of Tokyo
E-mail: Iwin@skl.iis.u-tokyo.ac.jp
Abstract:Center for Spatial Information Science, University of Tokyo
E-mail: Iwin@skl.iis.u-tokyo.ac.jp
One of the major limitations in detecting and tracing spatio-temporal changes of land covers using satellite imagery is the spatial and temporal resolution of the sensors. The high spatial resolution obtains low temporal high temporal resolution like Landsat TM, which cannot detect rapid change, On the other hand, low spatial resolution obtains high temporal resolution like NOAA AVHRR, which cannot detect detailed spatial change. In this study we used both Landsat TM and AVHRR images, where deforestation were monitored by AVHRR Time Series Images. In order to understand causes of deforestation process, we also analyzed relation between deforestation and landscape attribution using GIS and generated a deforestation risk map based on the analyzed results.
Key Words:
Land Cover Change Detection and Monitoring, Deforestation, Difference resolution satellite images. Annual spatial Expansion of Deforestation, GIS role in analysis of deforestation process.
1. Introduction
Deforestation, desertification, pollution and resources depletion are now serious problems in the world, which threaten the survival of half of the living things in the world. By understanding of these environmental change processes, we can conserve renewable or non-renewable resources that can be used for future generation without seriously damage.
On the other hand, one of the major limitations in study of change detection is satellite resolution problem due to different observational frequencies. Classical change detection studies were performed by single data image processing, which cannot allow to detect subtle change or annual change.
In this study, we demonstrated that combination that combination of two-resolution satellite image (Landsat TM and AVHRR) allows to detect and monitor changes with finer spatial and temporal resolution. In order to understand causes of deforestation process, we also analyzed relation between deforestation process and landscape attributes deforestation process and landscape attributes using GIS.
2. Description of the Study
2.1 Study Area
The study area is lower part of Myanmar, located between Thailand and India.
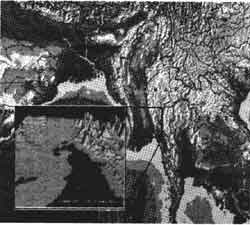
Figure 1. Location of Study Area
The total study area is 2,798,936 hectares (170 km X 165 Km) and elevation is ranging from between 0 to 2000m. Western part of the mountain is ranging from 0 to 200m and eastern part of the mountain is ranging from 0 to 2000m. The central area is flat region.
2.2 Study Objectives
The following are objectives of this study.
- To develop a method of land cover change detection and monitoring using different resolution satellite images.
- To analyze the relation of between deforestation process and Landscape attributes.
- To generate a deforestation risk map based on current deforestation process.
The following table shows by study materials and media that are used in this study.
| Satellite Images | |||
| Landsat | Date Acquired | Spatial Resolution | Source |
| Landsat TM | 9Jan 1999 | 30 x 30m (Raw Image) | EROS Data Center |
| Landsat TM | 7 Mar 1995 | 50m x50m(Geo-coded) | JAFTA Japan Forest Technical Association |
| NOAA AVHRR | 2 Jan 1989 31 Dec 1990 5 Jan 1992 29 Dec 1993 13 Jan 1994 1992 data set 1993 data set 1995 data set |
1Km x 1Km (Level 1 Raw) 1Km x 1Km |
National Institute for Environmental Study (Japan) 10 days Composite NDVI data (USGS EROS data center) |
| GIS Data | |||
| Township Vector Boundary (ARC Info Coverage Format)Road Network Vector file (ARC Info Coverage Format)DEM (Digital Elevation Model) 1 Km | |||
| Map and Statistical Data | |||
| Forest Cover Map of Lower
Myanmar Regions, Paper Map, Scale 1:250,00 (JAFTA) World Atlas (Digital Format) Myanmar Data on CD ROM (CSO, Ministry of National Planning and Economic Development, Myanmar) | |||
| Hard Ware and Software | |||
| PC and UNIX ERDAS Image Version 8.3.1 Windows NT o/s | |||
2.4 Study Flow
There are two steps in this study, first we generate the land cover change map between 1989 and 1995. The second step is monitor the spatial expansion of deforestation and analyzed the deforestation process.
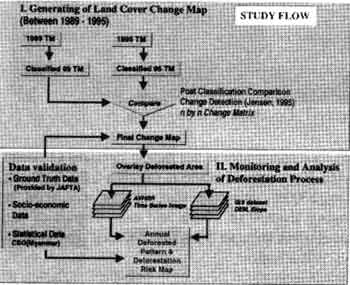
Figure 2. Over All Study Flow
3. Generating of Land Cover Change Map between 1989 to 1995
As a first step, the authors chose the study are is lower part of Myanmar. This are has variety of forest covers, which have been changed from 1989 to present time. The authors made field survey and collected ground truth data and reference information. The 1995 Landsat TM image and classified forest cover image were provided by JAFTA (Japanese Forest Technical Association).
As a pre-processing step for both 1989 Landsat TM and all AVHRR Time Series images, geometric correction (image registration), atmospheric correction, and sensor calibration for AVHRR image are conducted. 1995 Image has already geo-coded (Lambert Conformal Projection and resampled 50m spatial resolution) and used as reference co-ordinate system for other image processing.
To produce land cover map of 1989, we used both ISODATA classification (clustering) and supervised classification algorithms. To perform supervised classification, we create 21 training data sets made by Area Of Interest (AOIs) based on spectral differences in classified image, topographic features, previous knowledge and, applied maximum likelihood classifier.
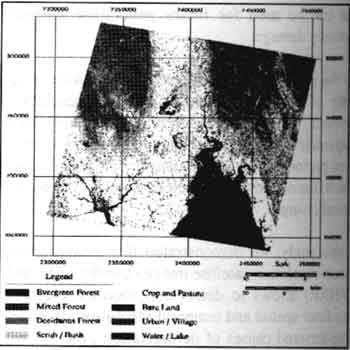
Figure 3. Land Cover Classification of 1989
As a result, 8 classes were discriminated in this study and land cover map was produced. ISODATA CLASSIFICATION was just used to refine our training data sets. Land Cover Map for 1995 was modified from JAFTA forest classification map. Originally classified image has 18 classes which were combined into eight classes.
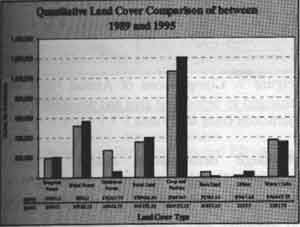
Figure 4. Land Cover Area Comparision of 1989 and 1995.
Changes in land cover between the two dates (ie. 1989 and 1995) were detected by using Post classification comparison algorithm (Jensen, 1995). Pairs of classified TM image were compared pixel by pixel. Evergreen Forest, Mixed Forest and Deciduous Forest Were grouped into one class and named as Forest.
| 1989 classified Image | Code | 1995Classified Image | Code |
| Forest | 36 | Forest | 37 |
| Scrub | 30 | Scrub | 38 |
| Crop | 24 | Crop | 39 |
| Bare | 18 | Bare | 40 |
| Urban | 12 | Urban | 41 |
| Water | 6 | Water | 42 |
| 95 Forest | 95 Scrub | 95 Crop | 95 Bare | 95 Urban | 95 Water | |
| 89 Forest | 1 | 2 | 3 | 4 | 5 | 6 |
| 89 Scrub | 7 | 8 | 9 | 10 | 11 | 12 |
| 89 Crop | 13 | 14 | 15 | 16 | 17 | 18 |
| 89 Bare | 19 | 20 | 21 | 22 | 23 | 24 |
| 89 Urban | 25 | 26 | 27 | 28 | 29 | 30 |
| 89 Water | 31 | 32 | 33 | 34 | 35 | 36 |
After re-coding and assigning in each land cover type, overlay each other and subtract 1989 land cover data from 1995 land cover data. The output values were between 1 to 36 according to their change categories, shown in table 3.
The change categories are as follow,
- Deforested are (Forest to Scrub, Crop, Bare, and Urban)
- Reforested Area (Scrub to Forest, Crop to Forest)
- Change to Scrub (Every land cover type changed to scrub except forest)
- Change to Crop (Every land Cover type change to crop except forest)
- Change to Bare (Every land cover type changed to bare except forest)
- Change to Urban (Every land cover type changed to Urban except forest)
- Land to Water (Every land type changed to water except forest)
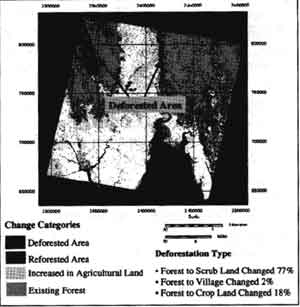
Figure 5. Land cover Change Map between 1989 to 1995.
| 95 Forest | 95 Scrub | 95 Crop | 95 Bare | 95 Urban | 95 Water | |
| 89 Forest | 781,166.00 | 194,922.00 | 46,786.00 | 441.00 | 5,723.00 | 2,646.00 |
| 89 Scrub | 55,586.00 | 111,573.00 | 171,549.00 | 882.00 | 14,112.00 | 3,528.00 |
| 89 Crop | 24,255.00 | 95,256.00 | 878,031.00 | 3,528.00 | 18,522.00 | 18,963.00 |
| 89 Bare | - | 1,764.00 | 38,367.00 | 882.00 | 3,528.00 | 8,379.00 |
| 89 Urban | - | 8882.00 | 13,230.00 | 2,205.00 | 3,528.00 | 4,410.00 |
| 89 Water | - | 3087.00 | 36,280.00 | 11,907.00 | 2,646.00 | 312,228.00 |
| Type of Deforestation | Area In Hect. | Percent |
| Forest To Scrub | 194,922 | 77.82 |
| Forest To Crop | 46,746 | 18.66 |
| Forest To Bare | 441 | 0.18 |
| Forest To Urban | 5,733 | 2.29 |
| Forest To Water | 2,646 | 1.06 |
According to the above figure, most of the deforestation caused by change forest to scrub land. 18% changes forest to Cropland and the 2.29% changes from forest to Urban / village.
4. Annual Expansion of Deforestation
As a second step, we monitored annual expansion of deforestation using AVHRR time series images. In particular, many researches apply the AVHRR temporal products for monitoring of temporal changes associated with vegetation, estimating rangeland productivity and monitoring of forest fire. AVHRR data have two indicators, which are associated with biophysical condition of vegetation. They are Normalized Difference Vegetation Index (NDVI) and surface temperature (Ts). Recent studies demonstrated the advantage of combining NDVI with Ts data for Land Cover Classification (Vasu and shibasaki, 1997) and Land Cover change Analysis (Lamibin and Ehrlish, 1995, 1996; Lambin and Strahler 1994a; Nemani and Running, 1996).
In this process, we compose every January AVHRR NDVI images and the pixel value was stretched 0 to 255 levels. NDVI threshold value for forest and non-forest transition is decided based on the 1995 land cover image overlaid on AVHRR NDVI Image. According to the figure 6 it is clearly seen that spatial expansion of deforestation within 6 years and deforestation was accelerated after 1992.
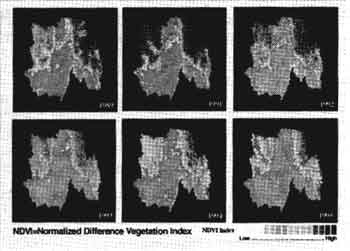
Figure 6. Yearly Spatial Expansion of Deforestation
In order to define temporal deforestation, pattern, we overlaid the deforested area, which was detected by Landsat TM on the AVHRR NDVI time series images and to compute mean NDVI values in the deforested area.
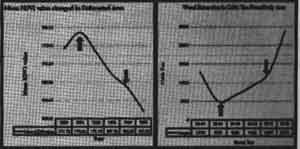
Figure 7. Comparisons of Annual NDVI value changed in deforested area and wood extraction in cubic ton from study area.
Although deforestation caused by various activities (logging activities, human activities, agricultural expanding), this pattern was quite similar to reverse relation of statistical data of wood extraction in cubic tons from study area. (NOTE: The statistical data does not exactly cover the whole study area).
5. Analysis of Deforestation Process
In order to delineate future deforestation risk area and to clarify relation between deforestation and landscape attributes, we used GIS data (Digital Elevation Model (DEM), transpiration network, and population data). This study is also demonstrated relation of between deforestation process and landscape attributes, which can be analyzed by integration of Remote Sensing and GIS technique.
5.1 Deforestation vs Elevation
This study was made by combination of deforested area image and 1km DEM (Digital Elevation Model).
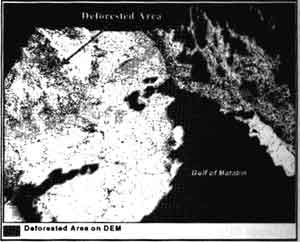
Figure 8. 3D Visualization of Deforestation on DEM.
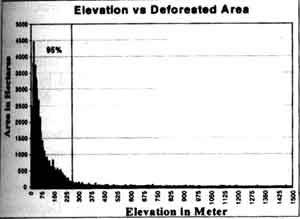
Figure 9. Relation of Deforestation and Elevation.
In this process, we assumed every 1km in each land covers were same elevation. First integrate land covers were same elevation. First integrate these two dataset and extract total numbers of deforestation pixels from DEM dataset. The 95% of total deforestation were occurred between 0 to 240m in elevation.
5.2 Deforestation vs Slope Gradient
This analysis was made by combine deforested image and slope gradient dataset which was generated from 1km DEM dataset. The total numbers of deforested pixel wee extracted from slope gradient dataset and plot the graph.
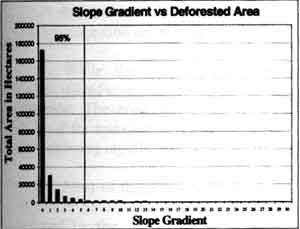
Figure 10. Relation of Deforestation and Slope Gradient
The 95% of total deforestation occurred within 0 to 5 degree in slope gradient.
5.3 Deforestation vs Transportation Network
This analysis was calculated as a series of buffers (1km to 20km) expending from each road network. It was found that the deforestation frequencies were decreased remote area from road net work.
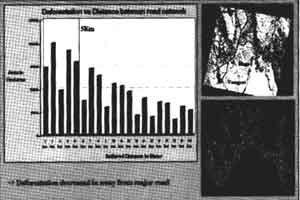
Figure 11. Analysis of Deforestation Vs Transportation Network.
5.4 Deforestation vs Population Density
The relation of between population density and deforestation has only weakly correlation. Although some township has low populated, the deforestation areas were more than other populated area.
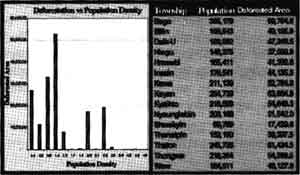
Figure 12. Relation of Population Density and Deforestation.
6. Generation of Deforestation Risk Map
We Produce future deforestation risk area map based on 95% deforestation condition (elevation is between 0 to 240m, slope gradient is 0 to 5degree, and major road within 5km).
Although deforestation is affected by many factors, such as changes in economic policy, human activity, agricultural activities, and illegal logging, the deforestation risk area map are requested to provided guidiance or regulation against irrational use of forest resources. In generating a deforestation risk map, we assumed forest cover is 1995 condition.
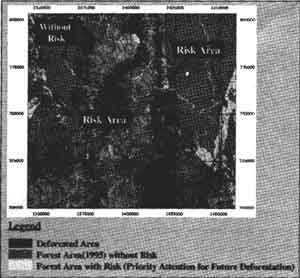
Figure 12. Deforestation risk map
7. Conclusion
The development of techniques for detection and monitoring of the deforestation are recently major interesting of environmentalists because of the depletion and destruction of the forest cover occurs all over the world. This study highlights the change detection technique using combination of different satellite resolutions that can be effectively detected and monitored the both detailed spatial and temporal change in forest resources. According to change results, deforestation is strongly related to economic policy, topography and accessibility.
Acknowledgement
We would like to acknowledge to Prof. Y. YASUOKA (Univ. of Tokyo) and National Center for Environmental Study (Japan) who provide NOAA AVHRR Images. We also wish to acknowledge to Mr. W. OHIRA (Data Analysis of Forest, JAFTA, Japan) who provide 1995 Landsat TM and classified image for this study.
References
- CSO, Central Statistical Organization, Mayanmar (Myanmar Data on CD ROM, 1997).
- ERDAS, Inc. (ERDAS Field Guide, Fourth edition). ERDAS Inc, Atlanta, GA.
- Floyd F. Sabin (Remote Sensing principles and Interpretation, Third Edition), W.H. Freeman and Company, New York.
- John R. Jensen, Dave Cowen, Sunil Narumalani, and Joanne Halls Principal of Change Detection Using Digital remote sensor Data) Integration of Geographic Information System and Remote Sensing, Edited by Jeffrey L. Star, John, E. Estes, Kenneth C. McGwire. Cambridge University Press.
- Michael N. DeMers (Fundamental of Geographic Information System), John Wiley & Sons, Inc.
- Ministry of forestry, (Country Report on Union of Myanmar by Forest Department, Myanmar), Working Paper No: APFSOS/WP/08.