| GISdevelopment.net ---> AARS ---> ACRS 1998 ---> Geology/Geomorphology |
The Environmental Monitoring
for Mt. Pinatubo Area in the Philippines Using Satellite Optical and SAR
Data
Genya Saito, Nobuyuki Mino,
Shigeo Ogawa, Takuhico Murakami, Naoki Isitsuka, Min Cong, Marcelina M.
Dumayac**, Arlene M. Evangelista*** and Hiroshi Ohkura****
National Institute of Agro-Envoronmental Sciences, 3-1-1 Kannondai Tukuba, Japan
**National mapping and Resource Information Authority, Fort Andres Bonifacio, 1201 Makati, Philippines
***Bureau of Soil and Water Management, Elliptical Rd. Corner Visayas Ave. Diliman, Quezon, Philippines
****National Research Institute of Earth Science and Disaster Prevention, 3-1, Tennodai, Tukuba, Japan
AbstractNational Institute of Agro-Envoronmental Sciences, 3-1-1 Kannondai Tukuba, Japan
**National mapping and Resource Information Authority, Fort Andres Bonifacio, 1201 Makati, Philippines
***Bureau of Soil and Water Management, Elliptical Rd. Corner Visayas Ave. Diliman, Quezon, Philippines
****National Research Institute of Earth Science and Disaster Prevention, 3-1, Tennodai, Tukuba, Japan
In this paper, the authors developed the methodology of vegetation cover ratios using multiple types of optical sensor data and clarified microwave backscattering characteristics on vegetation and environments acquired by Synthetic Aperture Radar (SAR). These data are used to analyze the effects of eruption from Mt. Pinatubo, the Philippines over a time period from 1991 (eruption time) to present (1997). By this satellite image analysis, chronological changes from vegetation damage in the term of decrease rate of vegetation cover caused by volcanic ash fall and suffered area by mudflows. Through satellite image analysis, changes in vegetation damage over time is assessed from the decrease in vegetation cover to volcanic ash and mudflows.
Introduction
Satellite remote sensing is only one method of monitoring vegetation changes. However it is very difficult to acquire optical remote sensing data at the coast and island in Asia monsoon area, because of the cloud cover. For the reason, we cannot perform using only one optical sensor to monitor vegetation for suitable interval and long term observation. We must use multi optical sensors and/or Synthetic Aperture Radar (SAR) sensors. Mt. Pinatubo that located the northern part of Luzon Island erupted hugely on June 15, 1991, and agriculture land and first in this area were suffered much damage owing to the eruption10. We monitored this area and estimated vegetation damage by ash falling and mudflows from Mt. Pinatubo using MOS-1/MESSR, LANDSAT/TM, JERS-1/OPS as optical sensors, and JERS-1/SAR and ERS-1/SAR as macro-wave sensors.
Optical Sensor Data
We used MOS-1/MESSR data that were before and after Mt. Pinatubo eruption, and LANDSAT/TM and JERS-1/OPS that were after the eruption. Table 1 shows the characteristics of used optical sensors and table 2 indicates list of used optical satellite sensor data.
| Satellite Name/Sensor | Using Period Operation Country | Resolution Recurrent Swath width | Band No | Wave length | Band Name |
| LANDSAT/TM MOSS-1/MESSR JERS-1/OPS |
USA 1984- Japan 1987-1995 Japan 1992- |
30mx30m 17 days 185km TM6:120mx120m 50mx50m 16days 100kmx2 18mx24m 44days 75km |
TM1 TM2 TM3 TM4 TM5 TM7 TM6 MESSR1 MESSR2 MESSR3 MESSR4 VNIR1 VNIR2 VNIR3 SWIR4 SWIR5 SWIR6 SWIR7 |
450-520nm 520-600nm 630-690nm 760-900nm 1550-1750nm 2080-2350nm 10.4-12.5mm 510-600nm 610-690nm 720-800nm 800-1100nm 520-600nm 630-690nm 760-860nm 1600-1710nm 2010-2120nm 2130-2250nm 2270-2400nm |
Blue Green Red Near infra-red Middle Infra-red Middle Infra-red Thermal Infra-red Green Red Near infra-red Green Red Near infra-red Middle Infra-red Middle Infra-red Middle Infra-red Middle Infra-red |
|
| |||
| Satellite /sensors | Path row side (sift) | Acquistion date yyyy/mm/dd | Remarks |
|
| |||
| MOS-1 | P29R98W | 1989/11/25 | before eruption |
| /MESSR | P29R99W | 1989/12/29 | 2 Scenes for making one mosaic image |
| ( | 1991/06/15 | date of the biggest eruption) | |
| P29R99W(2) | 1991/07/05 | after 20 days (special observation) | |
| P29R99W(2) | 1991/10/23 | after 4 months (special observation) | |
| P29R99W(2) | 1992/03/16 | after 9 months (special observation) | |
| LANDSAT | P116R49 | 1993/04/02 | after 2.5 years |
| /TM | P116R50 | 1993/04/02 | 2 scenes for making one mosaic image |
| JERS-1 | P90R275 | 1995/07/14 | after 4 years |
| /OPS | P91R275 | 1996/01/07 | 2 scenes for making one mosaic image |
|
| |||
SAR Data
Table 3 shows characteristics of SAR instruments and Table 4 shows the list of SAR data used in this study
| Sensor | Wavelength | Incident angle | Polarization | Spatial resolution | Swath |
| JERS-1 | L-band (1.275GHz 23.5cm) | 38.5 | HH | 18 m(3 looks) | 75 km |
| ERS-1 | C-band (5.3 Ghz 5.66cm) | 23 | VV | 15 m(3 looks) | 100km |
| Name of Senser | Date(YYYY/MM/DD) | Orbit | Treatment Level |
| JERS-1/SAR | 1993/03/23 | Descending | 2.1 Geometry correction |
| " | 1995/02/25 | " | " |
| ERS-1/SAR | 1993/08/29 | Ascending | 1.0 Raw image |
| ERS-1/SAR | 1995/11/19 | Descending | 0 Raw signal data |
| ERS-2/SAR | 1995/11/20 | " | 0 " |
| ERS-1/SAR | 1996/04/21 | Ascending | 0 " |
| ERS-2/SAR | 1996/04/22 | " | 0 " |
Monitoring using Optical Sensors
Georeferencing was performed using 1:50,000 scale topographic maps. A subset was taken to match the area before and after eruption. The study area is 1460 column and 1460 lines (73 km square).
The use of vegetation index was thought to be the most appropriate method to evaluate the extent of the damage in the Pinatubo area. Vegetation cover ratio was calculated by a kind of vegetation index (KVI)2) as equation (1). The equation for the KVI was derived as the difference between Near Infra-red (NIR) and Red (R) Band with a multiplication constant acting on Red Band as shown in formula (2).
VCR = DVI/ KVI max (1)
KVI = NIR- a x R - b (2)
These a and b are constant, a is obtained from the slope, and b in interception of Y axis of the soil line that constituted the description of bare soil on the plots of Red Band versus Near Infra-red Band.
An average value in the 4 pixels is assigned as the single value in the output image. After this treatment, one pixel size is 100 m by 100 m.
Determination of the degree of damage was derived from the difference of vegetation indices between the before- and after- eruption. The percentage of damage appears to show more reasonable behavior because we easily understand the situation of the damage. The percentage of damage (VCR (differ)) was calculated by formula (3).
| VCR (differ) = | VCR(before)-VCR (after)
VCR (before) |
x 100 |
In further analysis, the areas of clouds, shadows, smokes and low vegetation before eruption were determined. This was accomplished by selecting training samples of sea, land, clouds, cloud shadows, and smokes, and subsequent maximum likelihood classifications of the subsets to extract the areas of cloud, cloud shadow, and smoke coverage. The low vegetated area before eruption was extracted using KVI value. By these processes, the information necessary for making was provided analysis area. The masking area had no data about the vegetation damage, so these data was estimated from surrounding data.
A histogram was used to demarcate the severity of damage into five percentage-based categories in order to facilitate human visual interpretation. This result was categorized according to the degree of damage on the vegetation into five classes such as 100-90%, 90-60%, 60-30%, 30-10%, and 10-0%.
The result of 3 weeks after eruption, 100-90% damage to the vegetation occupies the largest area. After 4 month, the least damaged vegetation area (0-10% damage) is dominated. Along the rivers and the areas near the top of the volcano remaining in the highly damaged (100-90% damage). Estimated damaged areas are listed on Table 5. The area of most severely damaged (90-100% vegetation degraded) had attained as much as 164,000 ha in the date of three weeks after the eruption. While the most severely damaged area was decreased to about 22,000 ha at the time of 4 months after the eruption, but more than 30% damaged area was still existed more than 190,000 ha. The situation of 9 months and 2 years after eruption is almost same to the condition after 4 months. After 4 years, vegetation was recovered a little.
| Vegetation cover decrease ratio % |
After 20
days 1991/07/05 1000ha(%) |
4
months 1991/10/23 1000ha(%) |
9
months 1992/03/16 1000ha(%) | 2
years 1993/04/02 1000ha(%) |
4
years 1995/07/14 1996/01/07 1000ha(%) |
| 100-90 | 164(33) | 22(4) | 41(8) | 57(11) | 32(6) |
| 90-60 | 123(25) | 59(12) | 35(7) | 48(10) | 34(7) |
| 60-30 | 86(17) | 101(21) | 91(18) | 93(19) | 67(14) |
| 30-10 | 38(8) | 93(19) | 104(21) | 80(16) | 113(24) |
| 10-0 | 88(17) | 218(44) | 228(46) | 221(44) | 232(49) |
| After 4 months 1991/10/23 |
9 months 1992/03/16 |
2 years 1993/04/02 |
4
years 1995/07/14 1996/01/07 | |
| Damage area of mudflows 1000ha | 5 | 17 | 32 | 35 |
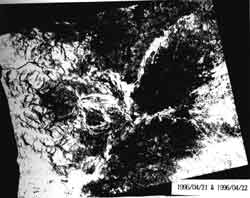
Photo 1 Phase coherent image
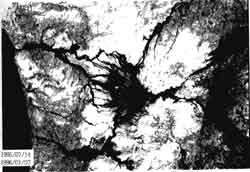
Photo 2 Vegetation Cover Ratio calculated from JERS-1/OPS data
Suffered areas of mudflows were extract as high damage area along the rivers systems, and this results listed at table 6. The suffered areas increased constantly.
Utilization of SAR Data 1- Back Scatter Strength-
SAR can observed earth surface through clouds. Positive optical sensors such as LANDSAT/TM and active micro-wave sensor such as SAR are very different from each other . We study Sar characteristics JERS-1/SAR and ERS-1&2/SAR.
JERS/SAR image indicates mudflow area very dark. To detect new mudflow area is not effective color composite of multi-time data, because agricultural areas are also dark. We adapted normalized differential method to detect new mudflow area as formula (4).
NDC : Normalized Differential Count
Dnold : Digital Number of old period
Dnnew: Digital Number of new period
At the ERS-1/SAR image is not so clear at mudflow area as JERS-1/SAR image and it may be occurred by difference of wavelength.
Utilization of SAR Data 2- The Phase Coherence at Tandem Mode ERS/SAR-
SAR technique mainly used back scattering factor, but recently SAR interferometry technique well developed. The interferometry technique used the information of micro-wave phase and two times observation data of small different orbits are used to get interferometryical fringes and then digital elevation model will be produced from interferometry fringes. Phase coherence is the factor of ability to make interferometry fringes Newly, it is cleared that vegetation reduces the phase coherence. We want to use this phenomena for estimation of vegetation cover ratio.
Photo 1 is the phase coherence at tandem mode ERS-1 &-2/SAR data, and photo 2 is vegetation cover ratio calculated from JERS-1/OPS. These two photos are almost reverse black and white image, and correlation coefficient of these two images in land area is -0.91 very high negative value. Using this relationship, we made vegetation cover ratio map from SAR data. We also get vegetation cover decrease ratio map using both optical sensor before eruption and microwave sensor after eruption, and showed a good coincidence with optically created ones using only optical sensors as mentioned above.
Reference
- Newhall, C. G. and R. S. Punongbayan (1996) : Fire and Mud, Eruption and Lahars of Mount Pinatubo, Philippines, pp1126. University of Washington Press, Seattle and London.
- Saito, G., Y. Yasuda and Y. Emori(1991) : Estimating sugar beet yields by spectral radiometer. Asian-Pacific Remote Sens. J., 4(1) 107-116.