| GISdevelopment.net ---> AARS ---> ACRS 1998 ---> Geology/Geomorphology |
Shoreline Change Detection
Using TOPSAR/AIRSAR Data
*Maged Marphany, Shattri
Mansor and **Mohd. Ibrahim Hj. Mohamed
*Faculty of Engineering
**Faculty of Science and Environmental Studies
Unieristi Putra Malaysia, 43400 UPM, Serdang, Seloangor Malaysia
E-mail: shattri@eng.upm.edu.my
Abstract*Faculty of Engineering
**Faculty of Science and Environmental Studies
Unieristi Putra Malaysia, 43400 UPM, Serdang, Seloangor Malaysia
E-mail: shattri@eng.upm.edu.my
This paper presents work done utilizing AIRSAR/TOPS data to detect shoreline change along Terengganu costline. TOPSTAR data was used to extract information on wave spectra. This wave spectra information was then used to model shoreline changes by investigating the wave refraction patterns. From these patterns, the volume transports at several location were estimated. The shoreline change model developed was designed to cover 20 km stretch or shoreline of Kuala Terengganu. The model utilized date from aerial photo, TOPSAR data and ground truth data. The location of sedimentation and erosion along shoreline of Kuala Terengganu was estimated.
The result showed that wave spectra extracted from TOPSTAR ranged from 20 m to 175 m. The direction of the wave spectra were from north-east to south-west. The wave refraction patterns were different from each other. The wave refraction patterns shows a convergence and divergence, which showed erosion and sedimentation locations, respectively. A comparison between TOPSTAR shoreline change model and aerial photo and ground truth data showed a significant relationship. Finally, the regression model showed that erosion occurred more at Sultan Mohammed Airport with -1.5 in/yr. The maximum rate of sedimentation was 1 m/yr.
Introduction Waves play an importance role for shoreline configuration. Wave patterns could induce the erosion and sedimentation. Radar imageries such as ERS-1 has a potential application for wave studies (Hasselman and Hasselman, 1991) and its effects on the shoreline change (Maged and Shattri, 1997b). Shoreline change studies based on wave spectra information is done by Maged and Shattri (1997) and Maged et al., (1998). In both studies, modeling of the shoreline change was based on the change of wave spectra pattern. However, Maged and Shatteri, (1997b) could not identify the location of erosion and sedimentation by using wave spectra information.
Raj. 1982; Mazlan et al., 1989; Frihy et al., 1994, used a different historical data of Satellite imageries, aerial photo and topographic maps to detect shoreline change. Most of these studies found an impossible rate of erosion occurred with more than 50 m/yr. For example Frihy et al., (1995) found the rate of erosion on Nile Delta is -70.8 m/yr. The stated that there is a significant relation between shoreline change estimated form the Landsat and aerial photo and ground survey with coefficient relation of 0.93. This can not be considered significant data to the fact that significant statistical tests such as Anova and t-test uses not performed. Results from Friehy et al., (1995) shows that the four peaks do not coincide. It means that the correlation value must be less than 0.93.
Chatterjee and Ghosh (1995) studies coastal erosion by using time series analysis of mapsheets and IRS-L1 satellite data. They also described tha wave refraction patterns along the study area (Bay of Bengal). However, this study could not find any correlation between wave refraction pattern change and shoreline change.
It can be said that using aerial photo alone for shoreline change considers as unperfected study to investigate the problem of crosion and sedimentation. The integration between other type of remote sensing data and coastal processes model is more optimize to investigate shoreline change for large scale. This can be dran a wide view on shoreline change pattern.
The main objective of this paper to model shoreline change based on the wave spectra modeled from AIRSAR/TOPSAR data.
Methodology
Study Area
The study area is located in the South China Sea between 5° 21' N to 5° 27' N and 103° 10'E to 103° 15'E. This area lies in an equatorial region dominated by two monsoon seasons (Maged, 1994). The southwest monsoon lasts from May to September while the northeast monsoon lasts from October to March. The monsoon winds affect the direction and magnitude of the waves. Strong waves are prevalent during the northeast monsoon when the prevailing wave direction is from the north from December to February, while during the southeast monsoon (May to September), the wave direction from the south (Maged and Ibrahim 1996).
The estimation of wave Spectra from AIRSAR/TOPS imagery
The ground wave parameters were collected during the flight time of AIRSAR at 10.00 am to 12.00 to 6th of December 1996. The C-band AIRSAR/TOPSAR imagery will be used in this study. The data was acquired in 6th of December 1996. The data was processed using PCI EASI/PACE image processing system. Digital image processing includes Fast Fourier Transform for wave spectra generation. This method is described in Vachon et al., (1994)
Shoreline Change Model
The shoreline change model will be used to investigate wave refraction pattern along the coastal water of Kuala Terengganu. The Hygnes's method was used to draw the wave refraction pattern rays as described in Maged et al., (1997a). Huygen's principle states that all points on the wave front can be considered as point sources for the production of spherical secondary wavelets. The new wave from is the envelope of all the small wavelets. The shoreline change will be a function of the sediment transport rate. The sediment transport rate Q will be a function of average wave energy between the wave orthogonal. The shoreline change, Dy is given by the following relation.
Dy= (Qi-1 -Qi) Dt/Dx (i)
where Qi-1 is the littoral drifts from Cell I-1 into cell I, Q1 is the rates of littoral drift from cell I to cell I+1. Dt is the increment of time (month or year). The erosion occurs if y is negative while sedimentation occurs when y is positive. The wave parameters estimated from the AIRSAR image are the significant wave height, period and direction.
Shoreline Change estimated from Aerial Photo
Mages and Shattri (1997) used aerial photo to estimate the shoreline rate change between 1980 and 1994 are estimated from the aerial photo. These results will be compared to the AIRSAR and wave model results. In order to identify locations always expose to sedimentation and erosion.
Finally, the mathematical regression model will be applied with the different sources of shoreline change models to find a correlation. This will be useful to investigate area exposed to erosion and sedimentation.
Results and Discussions
Figure 2 shows the wave spectra extracted from AIRSAR/TOPSAR data. The wave spectra are represented as circle and arrow. The circle represents the wavelength and the arrow represents the wave spectra direction. The dominant wavelength is about 175 m. This wavelength decreased near to shore to 75 m. The wave spectra moved from northeast to southwest direction. Figure 3a shows wave refraction pattern modeled from average of five years data during the month of December (1979-1982). Figure 3b shows the wave refraction pattern modeled from AIRSAR data and truth data in 6th December 1996. The wave refraction pattern results showed that the wave orthogonal configuration occurred in the Sultan Mohamed Airport whereas the wave orthogonal convergence occurred in UPM. Figure 4 shows the shoreline change rate modeled from the wave refraction patterns, compared to the ones estimated from aerial photography with topographic map. It is interested to find that different sources of data produced similar. The rate of erosion found at Sultan Mohamed Airport is -1.4m/y modeled from AIRSAR wave spectra. The rate of shoreline change modeled from truth data was decreased to -1.1 m/yr while the ones estimated from aerial photographic is less than 0.5 m/yr. The maximum rate of sedimentation occurred at UPM beach with 1 m/yr modeled from AIRSR wave spectra and wave truth data. The regression analysis model showed that there is a linear regression between different modeled. The r2 is 0.76 which shows a good correlation (Figure 5). Furthermore, there is a significant relation between AIRSAR results and aerial photo results shown by a significant F value (Figure 5).
The shoreline change profile shows that erosion mostly occurred in Sultan Mohamed Airport during the month of December. The wave orthogonal propagated from the north during the northeast monsoon tended to converge along this area. According to Komar, 1976; Luckman et al., 1995; Maged et al., 1997a the convergence zone indicates an erosion that convergence zone indicates high energy input. This high-energy input will induce strong littoral drift along the shoreline, which carried this material to an accretion place. It can be investigated the direction of littoral drift from Figure 4. It can be said that the littoral drift moved from north to south during north-east monsoon. A similar finding was found by Masture, (1987) and Luckman et al., (1995).
Conclusion
In conclusion, the information of wave spectra along the coastline can be used to model shoreline change. AIRSAR data is a potential data to model shoreline change pattern based on wave refraction patterns. It has been shown that erosion always occurred at the Sultan Mohamed Airport while accretion occurred alternatively to the erosion area. This means that accretion occurred due to transport of erosion material by littoral drift to deposit at the accretion area. It can be said the integration between AIRSAR data, wave model and aerial photography would be a good alternative to predict shoreline change.
References
- Chatterjee S. and B. N. Ghosh 1995. Identification of the Cause of Coastal Erosion at Digha, India By Remote Sensing. Proceeding of the 3rd Thematic Conference Remote sensing for marine and Coastal Environments. 18-20 September 1995, Seattle, Washington, USA.
- Frihy O. E., S. M. Nasr, M. M. El Hatab and M. El Raey 1995. Remote sensing of Beach Erosion Along the Rosetta Promontary, Northwestern Nile delta , Egypt. Int. J. Remote Sensing: 15(8) pp. 1649-1660.
- Hasselman, K. and Hasselmann S. 1991 "On the Nonlinear Mapping of an Ocean Spectrum and Its Inversion" .J. Geophys. Res., 96(C6). Pp. 10,713-10,799.
- Komar, P. D. 1976. Bech Processes and Sedimentation. Prentic-Hall, New Jersey.
- Lukman, M. H. Y. Rosnan and S. Saad 1995. : "Beach Erosion Variability during a North-east Monsoon: The Kuala Setiu Coastline, Terengganu, Malaysia" J. Pertanika 3: (2) pp. 337-348.
- Maged, M. M. 1994. Coastal Water Circulation off Kuala Terengganu, M. Sc. Thesis, Universiti Pertanian Malaysia.
- Maged, M., and Z. Ibrahim, Z. 1996. The Southern Oscillation and its Effect on Wave Height and Direction in the South China Sea. Proceedings of the National Conference on Climate Change, 12-13 August 1996, Universiti Pertanian Malaysia, Serdang.
- Maged, M. M. M. M. Ibrahim and Z. Ibrahim 1997a. ERS-1 AND Wave Refraction Modeling in the South China Sea. Paper Presented in International Marine Science Conference Assessment and Monitoring of Marine Systems. August 25-27. Primula Park Royal Beach Resort. Kuala Terengganu. Malaysia.
- Maged, M. M. and M. Shatteri 1997b. Offshore and Onshore Wave Spectra along Chendering Coastline. Paper Presented in 18th Asian Remote Sensing Conference: Nikko Hotel Kuala Lumpur 23-27 October.
- Mastura; S. 1987 Coastal Geomorphology of Desaru and its Implication for Coastal Zone Management. Monograph no. 13. Bangi: Universiti Kebangsaan Malaysia.
- Mazlan, H., I. Aziaz and A. Abdullah 1989. Preliminary Evaluation of Photogrammetric-remote sensing Approach in Monitoring Shoreline Erosion. Proceeding of the Tenth Asian Conference on Remote Sensing. November 23-29 1989. Kuala Lumpur. Malaysia.
- Raj, J. K. 1982. Net Directions and Rates of Present-day Beach Sediment Transport by Littoral Drift along the East Coast of Peninsular Malaysia. Geol. Soc., Malaysia Bull. 15:57-82.
- Rosnan, Y. 1987. Geophysical Studies in Setiu Lagoon Estuary System. M. Sc. Thesis, Universiti Pertanian Malaysia.
- Stanley Consultants Inc. 1985. Malaysian National Coastal Erosion Study. Vol. II. Kuala Lumpur: UPEN.
- Vachon P. W., K. E. Harold and J. Scott. 1994. Airborne and Spaceborne Synthetic Aperture Radar Observations of ocean waves. J. Atmo.-Ocean 32 (10); 83-112.
- Wong, P. P., 1981. Beach Change on a monsoon coast, Peninsular Malaysia. J. Geol. Soc. Malaysia. 14:59-47.
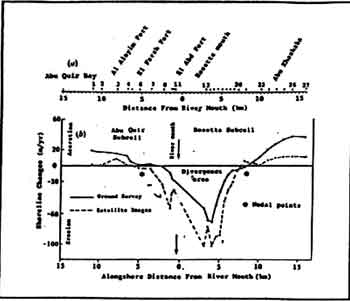
Fig 1 Shoreline Change (After Frighty et al., 1995)
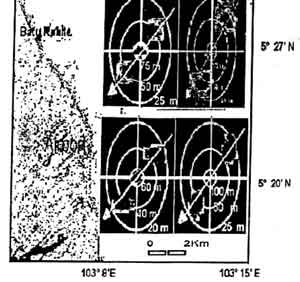
Fig 2 AIRSAR Wave Spectra
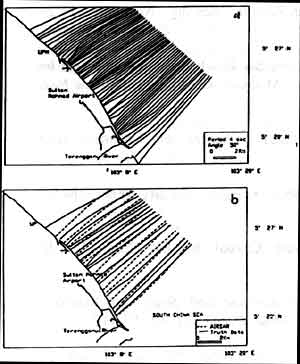
Fig 3 Wave Refraction Patterns (a) Ship Observation (b) AIRSAR and Truth Data
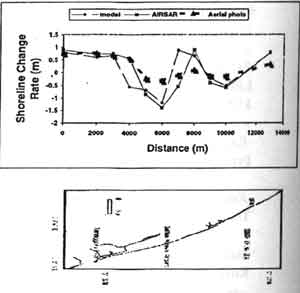
Fig 4 Shoreline Change Modeled from AIRSAR, Aerial photo and Wave Model
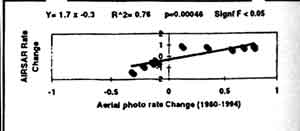
Fig 5 Regression Model of Shoreline Change for AIRSAR and Aerial photo