| GISdevelopment.net ---> AARS ---> ACRS 1998 ---> Geology/Geomorphology |
AirSAR Capability to
Geomorphology and Geologic Mapping Application
R. V. Abundo1,
E. Parringit2, D. S. Domingo III1, and M.
Lituanas1
1Mines and Geosciences Bureau North Avenue
Diliman, Quezon City, 1104, Philippines
Tel/Fax : (632) 9288544
email : totie@pacific.net.ph
2Remote Sensing Center, University of the Philippines
Diliman, Quezon City, 1101, Philippines
Tel: (632)434-3633
Abstract 1Mines and Geosciences Bureau North Avenue
Diliman, Quezon City, 1104, Philippines
Tel/Fax : (632) 9288544
email : totie@pacific.net.ph
2Remote Sensing Center, University of the Philippines
Diliman, Quezon City, 1101, Philippines
Tel: (632)434-3633
The airborne synthetic aperture radar (Air SAR) System developed by the National Aeronautics and Space Administration-Jet Propulsions Laboratories (NASA-JPL) is one of latest tools and a multi-disciplinary approach in remote sensing currently being used in a growing number of applications, such as vegetation classification, urban planning, environment assessment, etc. Its further use in geologic mapping and data analysis is studied here. This study is part of the ongoing NASA-Philippines AirSAR project
The area of concern is the northern part of Guimaras Island and southeast Panay and the adjacent shortline. Radar images from AirSAR were processed using 3 wavelength bands, namely : C-band (3.75-7.5 cm), L-band (15-30 cm), and P-band (30-100 cm), which were analyzed for geologic and structural data. Results were compared with present geologic map of the area.
AirSAR is a very useful tool as its multiple capabilities-polarimetry, interferometry, multi-frequency-have widened the range of applications for imaging radar measurements.
Introduction
In November 1996, the National Aeronautics and Space Administration-jet Propulsion Laboratories (NASA-JPL) launched the Pacific Rim (PACRIM) airborne synthetic aperture radar (AirSAR) mission. The mission covers specific targets areas in the Philippines, Malaysia, Papua New Guinea, Australia, and New Zealand. The aircraft, a DC-8, carries a three-frequency, full polarization synthetic aperture system, the most advanced system available. The AirSAR is one of latest tools currently being used in growing number of applications such as vegetation classification, urban planning, and environment assessment. Its further use in geologic mapping and data analysis is studied here.
The area of concern in the northern Guimaras and southeastern Panay and the adjacent shoreline, centered at 122°39' longitude and 10°46' latitude (Fig. 1). Two smaller test areas are selected, one in northern Guimaras and the other in Dumangas, Iloilo, area (Fig. 2, 3).
Definitions
AirSAR data from the northern Guimaras and southeastern Panay Island are obtained. The data acquired are the C-, L-, and P-bands, having wavelengths from 5.6 cm, 24.5 cm and 68.0 cm respectively. The particular wavebands used for the AirSAR are give in Table 1. These radar bands can be polarized, usually by switching between horizontal and vertical antennas i.e., the radar signal can be transmitted horizontally or vertically and the return signal received either horizontally or vertically. For this study, available polarizations are horizontal transmit, horizontal receive (HH); vertical transmit, vertical received (VV); and horizontal transmit, vertical received (HV), with an additional "total available power' (TP) for the three bands. "Total available power" refers to the power received by an antenna perfectly matched to the polarized part of the return wave for all transmit polarizations (Evans, et al, 1988).
Table 1. Brief description of NASA-JPL AirSAR system-POLSAR mode (Polarimeric SAR)
Polarimetric synthetic aperture radar (POLSAR) data were originally referred to as AirSAR data. For this study, AirSAR refers to POLSAR data.
A scattering matrix in which the transverse components of the scattered wave electric field are related to those of the incident wave electric field can model the scattering behavior of an object. Zebker et al. describe a technique by which each element of a scattering matrix was measured on a pixel by pixel basis by the NASA-JPL SAR, and show how knowledge of the scattering matrix allows calculation of the scattering cross section of a scatterer for any assumed transmit and receive polarization combination. Van Zyl et et al. described a similar matrix, the Stokes matrix derived from a set of scattering matrices that merits the same calculation in terms of average scattering properties of a region. Analysis of the Strokes matrix forms the basis of the techniques for this paper (Evan et al., 1988).
General geologic and topographic setting
The study area generally comprises the lowland coastal areas of Guimaras and Iloilo. The dominant lithology is limestone in Guimaras and Quaternary alluvium for most of the coastal area in Iloilo. The highest elevation is about 100 meters while the lowest is at sea level. The area has a generally gently sloping gradient, mainly low level relief hills or tidal flats.
Methodology
We used the environment for Visual imaging Software (ENVI) developed by Research System Incorporated (RSI) to process AirSAR images.
The Iloilo-Guimaras AirSAR site has the dimensions 40.5 km swath length x 8.5 km across track. Using the subset command in ENVI, the study are was first defined in order to isolate the area from the northern Guimaras and Panay swath (Fig. 2,3). The data in C, L and P-bands which are in Stokes Matrix are then e compressed-synthesized using the ENVI software. Polarizations of the bands include HH, VV, and HV, with an additional "total available power" (TP) band.
Images showing the maximum polarization returns are then selected and enhanced to sharpen image details using interactive Stretching command in the ENVI. We used the total power of the C, L and P bands because it produces greater clarity in tonal differences between different lithologies as well as structures. The TP of C-, L-, P-bands are combined in a Red-Green-Blue (RGB) scheme respectively to further maximize or highlight geologic features in the study area.
Results and Analysis
In more details of the geology, Quaternary alluvial deposits are unconsolidated sand, silt, pebbled, cobbles with broken shells and foraminefera on beaches and river deltas (Geologic Map of Iloilo, 1996). These deposits are found along the rivermouth of Iloilo, Jaro and Jalaud, where silty to sandy beds are much pronounced deposition, forming continuously along coastline of the Iloilo Strait. Similar de position is likely to befound in Guimaras Island inlet bay areas (Geologic Map of Iloilo, 1996). These alluvial deposits exhibit darker tones (Fig. 2 and 3) which can be attributed to the smooth surface of such deposits (Momani, 1996).
The predominant limestone in Guimaras, Buenavista Limestone, is a low dipping, calcareous to massive, fossiliferous, lime-rich limestone (Geologic Map of Iloilo, 1996). In contrast to the limestone in Iloilo, the Dingle Formation ahs thi bedded, cream to gray, hard and fragmental, with interbeds of very limy coarse g rained sandstone and limestone (Geologic Map of Dumangas, 1996). The limestone formations can be easily outlined on the AIRSAR image as they show a lighter signature compared to alluvial deposits (Fig. 2,3). This is due to the rougher surficial expression characteristic of limestone (Momani, 1996) deposits which exhibits karst topography. In the Guimaras area, the limestone signature further exhibits light-and-shadow tones, which are characteristic of bedded formations (Sabins, 1987). Note that the Buenavista Limestone cannot be easily distinguished from the Dingle Limestone as both formations exhibit similar surface roughness.
A diorite intrusive, Guimaras Divorite, near center of the island is described as silicified diorite porphyry with associated andesite porphyry (Geoogic Map of Dumangas, 1996). This diorite in Guimaras exhibis the lightest tone in the study area, which is probably caused by the higher backscatter of rock fragments.
In terms of geomorphology, active tidal flats typify the Iloilo coastal areas, with some rural developments for fishponds and saltbeds. These show tones in AIRSAR image (Fig. 2). Note that fishpens and rural areas are easily distinguished. The major lowlands adjacent to the coast are exemplified by broad alluvial plains that are somewhat drained. Low, isolated limestone hills are exposed on certain areas of Iloilo (Fig. 4).
Structural lineament is aptly defined by differences in elevation in Guimaras Island, which trends to the north. This cuts through the limestone and diorite formations. Stream drainage exhibit semi-braided signature from the lowland alluvial area to the coastline (Fig. 1).
Conclusion
AIRSAR is a very useful for geologic and geomorphologic mapping application Iloilo and Guimaras. The use of total available popwer for C-, L-, and P-bands is suitable for mapping geologic structure litholigies, and geomorphologic features for this study. It can distinguish between major lithologies and features in terms of surface roughness and expressions. However, it should be noted that lithologic surfaces having similar roughness with a different adjacent lithology would yield similar polarimetric characteristics and should be ground confirmed.
References
- Evans, D. L., Farr, T. G. Van Zyl, J. J., Zebker, H. A., 1988. Radar Polarimetry: Analysis and Application. EEE Transaction on Geosciences and Remoter Sensing. Vol. 26. No. 6. pp. 774-789
- Geological Quandrangle Map of Dumangas. 1st ed. 1996. Mines and Geosciences Bureau - Department of Environmental and Natural Resources
- Geological Quadrangle Map of Iloilo, 1st ed. 1996 Mines and Geosciences Bureau - Department of Environment and Natural Resources
- Momani, M. R. V. Singhoy and R. Saint-Jean, 1996. Mapping Surface Characteristics of Aquifers in Jordan from Integrated SAR Images. Proceedings of the Elevanth Thematic Conference on Applied Remote Sensing, vol. 2, pp. 691-699, Las Vegas, Nevada, USA
- Sabins, Jr., F. F., 1987. Remote Sensing: Principles and Interpretation, 2ed. W. H. Freeman and and Company, New
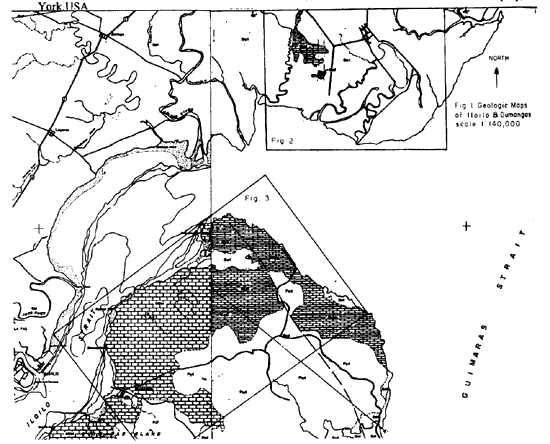
Fig 1 Geologic Maps of ILoilo & dumangas scale 1:40,000
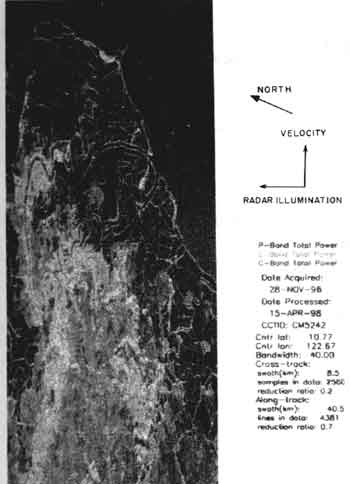
Fig 2 AIRSAR image of Southern Iloilo
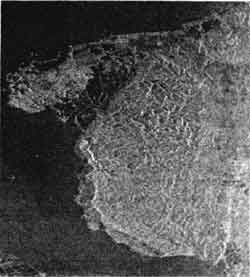
Fig 3 AIRSAR image of Northern Gulmaras island
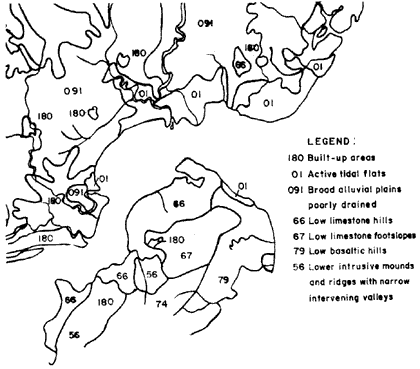
Fig 4 Geomorphology Map of Iloilo Strait Coastal Panay