| GISdevelopment.net ---> AARS ---> ACRS 1998 ---> Forest/Resources |
Decision of Threshold Values
for Extraction of Mangrove Area with TM Data of Landsat 5
Kazuhiro Sato*, Minoru
Nakajima**, and Takashi Hoshi***
* : College of Agriculture, University of the Ryukus,
Senbaru 1, Nishihihara, Okinawa 903-0129, Japan
Tel. 81-98-895-8792, Fax. 81-98-895-8734,
E-mail : sato4408@agr.u-ryukyu.ac.jp
** : Omodaka Electronics Co. Ltd., 101 Column Otsuka,
Ostuka 4-43-9, Bunkyou-ku, Tokyo 112-0012, Japan
Tel. 81-3-3944-8661, Fax. 81-3-3944-8972,
E-mail : omodec@mub.biglobe.ne.jp
***: Faculty of Engineering, Ibaraki University,
Nakanaarisawa 4-12-1, Hitachi, Ibaraki 316-8511, Japan
Tel. 81-294-38-5133, Fax. 81-294-37-2223,
E-mail : hoshi@cis.ibaraki.ac.jp
Abstract* : College of Agriculture, University of the Ryukus,
Senbaru 1, Nishihihara, Okinawa 903-0129, Japan
Tel. 81-98-895-8792, Fax. 81-98-895-8734,
E-mail : sato4408@agr.u-ryukyu.ac.jp
** : Omodaka Electronics Co. Ltd., 101 Column Otsuka,
Ostuka 4-43-9, Bunkyou-ku, Tokyo 112-0012, Japan
Tel. 81-3-3944-8661, Fax. 81-3-3944-8972,
E-mail : omodec@mub.biglobe.ne.jp
***: Faculty of Engineering, Ibaraki University,
Nakanaarisawa 4-12-1, Hitachi, Ibaraki 316-8511, Japan
Tel. 81-294-38-5133, Fax. 81-294-37-2223,
E-mail : hoshi@cis.ibaraki.ac.jp
Mangrove area is an important coastal ecosystem in the tropical and sub-tropical coastal regions. One of the characteristics is to have both almost similar crown layer with land common forests and quite different forest floor with them. The floor is flooded above every high tide times and water content of the floor is almost saturated even low tide times. One mask procedure had been suggested for effective extraction of mangrove area using TM data of Landset 5 to pay attention to the matter.
In this paper, it was examined how to decide the threshold values without drawing of profiles of CCT count. One empirical and practical way was suggested because statistical characteristic is not still clear on the CCT count values of pixels distributed along the boundary between mangrove area and land area or water. A systematic decision of the threshold values and preparation of masks become possible by addition of some devices to existing software.
Introduction
We have examined qualitative and quantitative simultaneous expression of information on mangrove forest using remote sensing technics4.5). It is assumed that qualitative information are forest type, operation type, species, mixture ratio and so on, and quantitative information are tree height, diameter at breast height (DBH) and stand stock or biomass. Some classifiers are useful for qualitative classification and regression analysis is useful for quantitative estimation. One of the authors and other core searchers reported relationships among TM data of Landsat 5 and stand parameters on mangrove forest1.2.3). As it is deserved there is not so large difference among CCT count of each pixels next to each other is relatively smaller. For band 4 and 5, such value becomes large for the pixels distributed both sides of the boundary between mangrove area and land area or waters. This matte should be the key to decide threshold values between mangrove area and land area or water. But the statistical examination on the matter is just started. It will take more time to clear this problem.
In this paper, we examined and suggested illogical but practical way to search and decide fit threshold values. It depends on fast processing quickness of a personal computer system and our judgment.
Method
We used a set of TM data of Landsat 5 without band 6 acquired on 25 April 1990. It covered Mandah area distributed mangrove forest in this mouth of the Inderagiri River, Sumatera.
In the system for image or remote sensing processing, frequency distribution curve of CCT count is drawn frequently. Two curves for band 4 and 5 were shown in fig.-1. There are two clear large peaks on the curves of band 4 and three peaks for band 5. For band 4, tapering left peak is a group from water and right peak is a group from mangrove area and land area. In this band there is no clear partition between mangrove area and land vegetation. For band 5, the highest and narrow left peaks comes from water, higher central peak dose from mangrove area and small and narrow left peak dose from land area. A small notch is observed between mangrove area and land area.
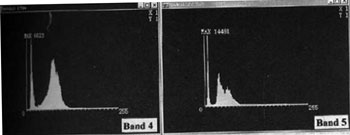
Fig.-1 Frequency distribution curves of CCT count of band 4(left) and band 5 (right), Mandah area, Sumatera, Indonesia
It can be easily expected that the threshold value between waters and mangrove area exists in the right valley of the peak from water in both figures. In this case, searching the value may be easy between mangrove area and land area because the notch is clear for band 5. This matter changes with occupied ratio of three categories in the whole scene and condition of distribution of water in land area such as swamp, ponds and channels.
The way suggested here is to search fit threshold value by increasing or decreasing tentative value in the range of this valley or notch. A flow chart of this procedure is shown in fig.-2. The main procedure is to display five binary imagery by tentative values with reference imagery that is composed by RGB in a CRT. The fit threshold value is decided by synthetic judgment for fringe sharpness of categorized area, distribution of scattered dots in each side and change of total number of dots with increasing or decreasing K. inseparability between mangrove area and water or land area relates with the existence of cut over area, stand with reclaimed floor by crabs and squillae in mangrove area, swamp, ponds and channels in the land area. For removal of scattered dots in each side, logistic operation, filtering and topographic observation are useful. In fig.-2, procedure of operation between masks is shown for preparation of mask for mangrove area.
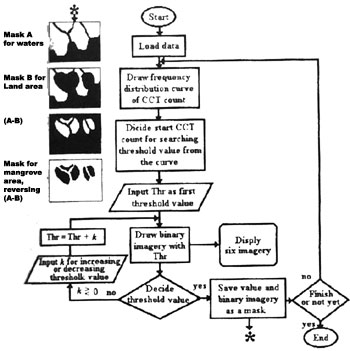
Fig . 2 Flow chart of procedure to decide fit threshold value between mangrove area and waters or land and making a mask for three categories
Results and Discussion
An example of display composed six imagery on a CRT for searching fit threshold value is shown in fig.-3 and fig.-4. If the fit threshold value is decided by drawing profiles of CCT count across boundary between mangrove area and water or land area, profiles must be drawn at many points across the boundary. It is not clear to set the point where and how many.
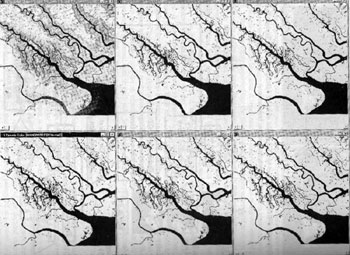
Fig.-3 An example of five binary imagery with reference composed by RGB in a CTR to search fit threshold value for making mask of waters with band 4
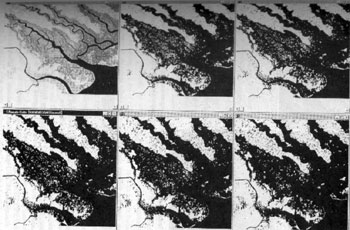
Fig.-4 An example of five binary imagery with reference composed by RGB in a CTR to search fit threshold value for making mask of land area with band 5.
The way suggested in this paper is not logistic way but it is practical, easy and fast, and dose not take so long time because of fast processing quickness of resent personal computer system. The judgment also is not difficult because it is possible to compare among binary imagery with different threshold value and confirm the fitness of the decided value repeatedly. By this way, a series of needed works and procedure can be processed in a system. So it becomes possible to build up a system as one package for qualitative and quantitative simultaneous expression of mangrove forest. Separation of mangrove area from water and land area is fundamental condition for estimation of quantitative information on mangrove forest and also qualitative classification of mangrove area without interference from the outside. It is considered that the system as one package for stand analysis of mangrove forest is very useful for conservation, control and management of mangrove forest in the developing countries.
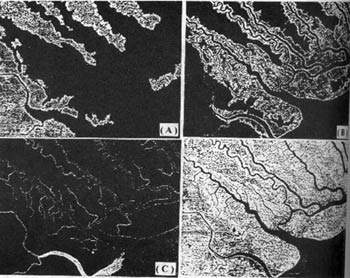
Fig.-5 Classified results for land area (A), mangrove area (B) and waters (C), and overlaid result with three separated categories
Conclusion
It become clear that the way suggested here was useful to decide fit threshold value for making mask to extract mangrove forest. It will be realized to develop one package system built in the way for stand analysis of mangrove forest in the near future.
Reference
- Dwi Setyono, Sato, K. & Kohda, Y.: Relationship Between TM Data of Landsat 5 and Stand Parameters on Mangrove Forest in Okinawa, J. Japan Soc. Photogrammetry and Remote Sensing, Vol. 36, No.2, 4~12, (1997)
- Dwi Setyono, Sato, K. & Kohda, Y.: Relationship Between Calculated Indexes from TM Data of Landsat 5 and Stand Parameters on Mangrove Forest in Okinawa, J. Japan Soc. Photogrammetry and Remote Sensing, Vol. 36, No.3, 6~12, (1997)
- Dwi Setyono:, PhD Thesis, Kagoshima University, (1997)
- Sato, K., Nakajima, M. & Hoshi, T.: Mask Procedure for Effective Classification of Mangrove Area and a Method to decide Threshold Values with TM Data of Landsat 5, Proc. of the 17TH ACRS, WS-1-1~6, (1996)
- Sato, K., Nakajima, M. & Hoshi, T.: Conception of Qualitative and Quantitative Classification of Mangrove Forest with TM Data of Landsat 5, Proc. of the 18TH ACRS, G-6-1~6, (1997)