| GISdevelopment.net ---> AARS ---> ACRS 1998 ---> Forest/Resources |
An Evaluation of
Multi-Band/Multipolarised SAR Data For Vegetation Discrimination, In
Malaysia
N.Laili, H. mariamni and
K.M. Noh
Malaysian center for Remote Sensing (MACRES)
CB 100, 5th Floor, city Square Centre, Jalan Tun Razak
50400 kuala Lumpur
Malaysia
E-mail: laili@macres.gov.my
Abstract Malaysian center for Remote Sensing (MACRES)
CB 100, 5th Floor, city Square Centre, Jalan Tun Razak
50400 kuala Lumpur
Malaysia
E-mail: laili@macres.gov.my
Optical and conventional SAR data such as Landsat TM, SPOT, ERS-1, Radarsat are being used widely fro mapping and monitoring of vegetation and other application in Malaysia. However these data, the optical and the conventional SAR , have some limitation due to cloud cover and single polarization & single frequency, respectively. The AISRF data of multi-polarization and multi-frequencies captured on a single date could minimize those obstacles.
In this study, AIRSAR data of bands L-HH, L-VV, L-HV, P-HH, P-VV and P-HV were analyzed for their potential in extracting information on vegetation such as forest, oil palm, rubber and non-vegetation such as clear-cut area and suburban, and radar backscattering coefficient (s0) derived for these classes were compared graphically, visual and statistically . the preliminary results proved a good discrimination, for vegetated and non-vegetated area. The oil palm and rubber could be discriminated in L band at all polarization, while rubber, natural forest and plantation forest are hardly discriminated.
Introduction
Land cover classification from SAR imagery is an important and continually developing application of microwave remote sensing. Advances in microwave technology have provided an improved measurement capability, allowing development of employing multiple-frequencies and multi-polarizations. The characterization and classification of land-cover using polar metric SAR data has been extensively invested and reported on. Diane L. Evans et al, 1998 had discriminated the vegetated and clear-cut area with polarization. Recently, K.S. Chen at. Al , 1996 analysed the radar respond of crop types to frequency and polarization for classification based on three configuration:1) multifrequency and single polarization images; 2) single-frequency and multi polarization images; and 3) multifrequency and multipolarizaiton images. Adoption of neural network and the classifier to classification show the p band multipolarizaiton images and multiband HH polarization images have better classification accuracy, while with a full configuration, namely multiband and multipolarizaiton gives the best discrimination capability.
This paper focuses on the multifrequecies and polar metrics classification of land cover from airborne radar image . different frequency and polarization extraction of backscatter have been implemented and compared.
Rubber
Rubber trees are either grown on large estate in units of hundred hectares or more, or by small holders on fields with size of only to few hectares. In both cases, the plantation is subject to characteristic planting and growing schedule. Young plants, some 1.2 m tall are planted on cleared areas were roots and trunk from previous vegetation have been removed. The ground is normally even and covered with short grass and legume. On flat and gently undulating terrain, the trees are planted in straight rows, normally in N-S or E-W direction, while terrace planting is practiced in undulating and rolling areas. The planting densities vary between 380-540 trees per ha. The trees grow to a total height of 12.20m , depending on the soil and terrain conditions. The trunk diameter seldom exceeds 30 cm. The leaves, some 7 by 13.cm in size, are shed once per year during the major dry season in December/February. After 20-25 year the productivity of latex decreased and if the plantation is abandoned, the trees will eventually start to cut off . before this happens, however, the fields are normally cleared and new generation of trees is planted.
Oil Palm
Oil palm trees are grown on large estates in units of hundred hectares or more, or by smallholders on field with size of only a few hectares. The trees are normally grown to a total height of between 12-20 m's including the large fronds , or branches, which fan out from the top of a straight, single trunk. Each fronds consists of an oblong stem from which some hundred long slender leaves extend out on opposite sides. The frond will reach lengths of 5 to 8m with in a few years after planting, exceeding a width of 2 at the center . The surface of the trunks is rough and covered with scale-like remnants of old fronds that have been cut off as the tree has grown. The palm trees are normally planted in asymmetrical triangular pattern on flat or gently undulating ground and in terraces in more hilly terrain. The ground is covered with grow of legumes and subsequently as the trees grow, with stacks of dead fronds. After 20-25 years the productivity decreases, the plantation are then normally cleared and new trees are transplanted.
Forest
Consist of tnatural forest and forest plantation. Natural forest consist of -(a) higland forest which has strongly mixed natural and very denser canopy in which the highest story ranges from 30-40m and the lower story is bushes and small trees; and (b) lowland forest in which tree species tend to be taller and larger than the high altitude rain forest trees. Forest plantations which consists of trees, bushes and other crops for commercial or industrial purposes which are monocrop.
Clear-cut
Appears after cutting off rubber or oil palm plantation (before replanting )
Suburban/settlement area
It consist of single-double story terrace house or bungalow house. Between the houses there are grasses, small vegetation or fruit trees.
Satellite data and Software
The remotely sensed data comprised of multifrequency (P, L bands ) polarimetric SAR data acquired by JPL over an area called 'Tapah' on 3 December 1996. For the purpose of our experiment we used a sub-image of 1141 x 948 pixels (figure 1) as it is apparently quite representative of all the land cover types comprised in the original SAR image. The software has been used is ENVI 3.0 ( the Environment for Visualizing Images).
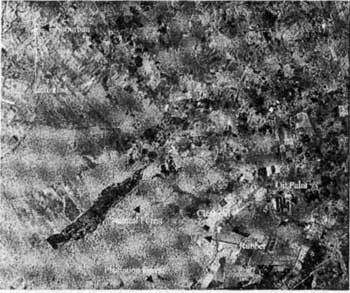
Figure 1: Images of the study area, Tapah Perak- LHH, LIT, LHV (R, G, and B)
Methodology
Decompress-Synthesized Images
Polimetric radar data typically comes as compressed scattering matrix format that, can not easily be viewed by most image processing software. ENVI'S synthesize functions provide an easy-to-use and flexible means of generating any combination of transmit/receive polarization images directly from JPL AIRSAR compressed Stoles matrix data (and AIRSAR portion of the TOPSAR data set ) or from SIR-C scattering matrix compressed data. This includes the standard HH, VV, HV and Total power images for each frequency.
Data correction-Slant to ground Range and Cross-Track Illumination Correction were done by JPL.
Identified region of interest-oil palm, natural forest, plantation forest, clear cut and suburban . Identification was done based on visual integration-(color, texture, pattern, size), field verification and topography map.
selection of sample size was done starting with 50 pixels for natural and plantation forest, oil palm and rubber and 750 pixels for suburban. The intensity vale was collected for each of the cover types. The pixels size was chose for each cover types and backscattering coefficients were recorded according to frequencies and polarizations .
Result and Discussions
The effect of the variation of incidence angel across AIRSAR (from 51° to 57°) on the s° is negligible. The study focuses on pixel number related to intensity stability and the s° of the cover types .
Pixel Number
The intensity stability for each class is summarized in figure 2. land cover, verification was done during aircraft flown and July 98 for identification the region of interest. Figure 2 ( a and b) show the intensity are higher at the smaller pixel number, and decrease when the pixels for suburban area. All the vegetation areas - natural forest, plantation forest, rubber and oil palm intensity stability were stable at 300 pixels and become uncertainty when the pixel size increase. The intensity stability was highly correlated with the homogeneity of the region of interest. For clear-cut and suburban areas the pixel number for intensity stability is higher than the vegetation area due to mixture of the properties such s houses, park and vegetation for suburban areas.
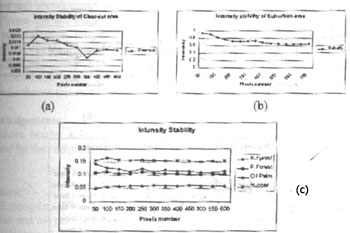
Figure 2: Graph (a) shows the intensity value of clear-cut. (b) Intensity value of suburban and (c) intensity values for vegetation
Multifrequencies and polarizations
Table 1 shows the backscattering coefficients (s0 ) obtained for L and P bands and multi polarization for different test field .
|
| ||||||||
| HH | VV | HV | TP | |||||
| L.Band | P.Band | L.Band | P.Band | L.Band | P.Bnad | L.Band | P.Band | |
|
| ||||||||
| P. Forest | -9.5624 | -10.6349 | -8.9076 | -11.1464 | -14.2251 | -16.6555 | -11.0403 | -12.8735 |
| N. forest | -9.4310 | -10.7624 | -9.6019 | -12.1042 | -15.0446 | -18.3268 | -11.4509 | -13.5952 |
| Rubber | -8.1730 | -9.0658 | -8.0632 | -9.3892 | -13.5360 | -15.4363 | -10.0305 | -11.3018 |
| Oil palm | -12.0621 | -10.1233 | -13.9041 | -11.3312 | -19.8716 | -17.6447 | -15.1004 | -12.8988 |
| Clear-cut | -19.0309 | -13.4008 | -17.7989 | -13.2606 | -27.4473 | -20.8092 | -20.8619 | -15.6225 |
| Suburban | -1.9260 | -2.4382 | -3.1007 | -3.7069 | -12.2695 | -15.6864 | -3.5379 | -12.6122 |
|
| ||||||||
| Different | ||||||||
|
| ||||||||
| P& N Forest | -0.1315 | 0.1275 | 0.6943 | 0.9578 | 0.8195 | 1.6714 | 0.4106 | 0.7217 |
| P forest & Rubber | -1.3894 | -1.5691 | -0.8444 | -1.7571 | -0.6891 | -1.2191 | -1.0097 | -1.5717 |
| P forest & oil Palm | 2.4996 | -0.5115 | 4.9965 | 0.1848 | 5.6465 | 0.9893 | 4.0602 | 0.0253 |
| Rubber & Oil Palm | 3.8891 | 1.0576 | 5.8409 | 1.9420 | 6.3357 | 2.2084 | 5.0699 | 1.5970 |
| Clear-cut suburban | -17.1049 | -10.9626 | -14.6982 | -9.5537 | -15.1778 | -5.1229 | -17.3239 | -3.0103 |
|
| ||||||||
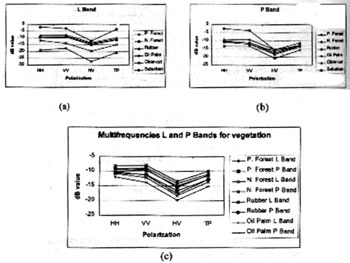
Figure 3: Graph (a) shows the polarization for L band, (b) the polarization of p band and (c) shows the polarization different of L and P bands for natural forest, plantation forest, oil palm and rubber.
The backscatter values were calculated as the mean values taken over all vegetation at the matured stage. Plant moisture content were assumed similar and negligible. The soil moisture is considered as the same for the study area due to flat area due to flat area and very fine weather during the flight flown .
Backscettering value for L and P bands can be seen fro the Tables 1 and Figure 3. for L and, the highest dB values is belonging to suburban area and the lowest values is clear-cut, while the vegetation areas are in the middle of these two. This scenario occurs as well for P band. Base on these phenomena, we could easily discriminate the clear-cut and suburban area, due to the differences off more than 3 dB at any frequencies and polarizations. Diane l Evans et at 1988, also found that the contrast polarization between vegetated area and clear-cut. For vegetation, the dB value is quite close see table 1. le toan et. Al 1997 used 3 dB as a threshold to discriminate rice field. To discriminate oil palm and rubber, L band is the best, where the dB different is more than 3 at any polarizations. The natural forest and plantation forest, is quite difficult to discriminate, because the difference of the dB value is less then 3 at any frequencies and polarizations. However, discrimination can be done to oil palm and plantation forest at L band for polarization VV, HV and TP. Rubber cannot be separated with natural and plantation forest. It might be due to similar characteristics of the vegetation and undergrowth at that area.
Conclusion and Remarks
The Aisar data with multi-frequencies and multi-polarization can discriminate the vegetated an no-vegetated area easily. Discrimination can be done for vegetation with different leaf and trunk structure ,like oil palm and rubber, while rubber, natural forest and plantation forest can not be discriminated. Identified frequencies and polarizations can do classification by segmentation for the vegetation . combination with C band and quantitative validation of vegetation area can further completer the study. Knowledge-based, expert system or neural network should be applicable to refine and enhance this study.
Acknowledgements
The authors hereby acknowledge the contribution given by Mr Nik Nasruddin Mahmood for the completion of this paper.
References :
- A . Rosenquist, 1996: "Evaluation of JERS-1, ERS-1 and Almaz SAR Backscatter for rubber and oil palm stands in West Malaysia. International Journal of Remote Sensing Volume 17, November 16, pp 3219.
- Chen K.S, Huang, W.P., Tsay, D.H. and Amar F, 1996." Classification of Multifrequency Polar metric SAR Imagery Using a Dynamic Learning Neural Network". ". IEEEE Transactions on Geoscience and Remote Sensing, Vol 34, No 3, May 1996, pp 814-820
- Diane L. Evans, Tom G Farr, Jakob J. Van Zyl and Howard A Zebker, 1988. " Radar Polarimetry : Analysis Tools and Application ". IFEEE Transactions on Geoscience and Remote Sensing, Vol 26, No 6, November 1988, pp 774-789.
- Huy Le Toan, Florence Ribbes, Li-Fang Wang , Nicolas Floury, Kung-Hau ding, Jin Au Kong, 1997. " Rice Crop Mapping and Monitoring ERS-1 Data Based on Experiment and Modeling Results ". IEEE Transactions on Geosciences and Remote Sensing, Vol 35, No 1, January 1997, pp 41-56.