| GISdevelopment.net ---> AARS ---> ACRS 1998 ---> Forest/Resources |
Characterizing Tropical
Forest in Kinabalu Park, Sabah, Malaysia, Using Landsat-TM Data
Phua Mui How1,
Hideki Saito2 and Masa Aniya3
Forest application of remote sensing deals mainly
what the canopy characteristics of forest. The advances in remote sensing
technology provide and alternative that may be supplementary to the
conventional methods, the field survey and the aerial photographs
interpretation, for forest information extraction and forest applications
at a regional scale. At a regional scale, satellite data can be a very
useful source for forest resources mapping and inventorying with the
reasonable costs and accuracy. Information on forest resources at a
regional scale. The objectives of this study are to examine the
characteristics of the tropical forest using Landsat-TM data, and to
investigate the relationship between forest variables of the tropical
forest and Landsat-TM data, and to investigate the relationships between
forest variables of the tropical forest and Landsat-TM and the tasseled
cap transformed data. Study Area
Kinabablu Park is located in the northern part of the state of Sabah, Malaysia, between 116° 28' and 116° 45'E and between 6° and 6° 30'N. Having an area of 75,370 h, it is the focus of the tourism activates in the state especially the southwestern part of the park where the highest mountain in Southeast Asia, Mount kinabalu (4096m) is located.
The vegetation in Kinabalu park was delineated inn to 6 discrete altitudinal floristic zones; Lowland (<1200 m), Lower montane (1200-2350m), Upper Montane 92350-2800m), Lower subalpine (2800-3400m), Upper subalpine (3400-3700m) and Alpine (>3700m), based on their great variations in the deominance type, species composition and forest structure (kitayama,1991). Kinabalu's vegetation zonation is comparable to many other mountains in the region of Malesia such as the Vegetation zonation of Mount Wilhelm in Papua New Guinea. Studying vegetation in Mount Kinabalu can therefore be useful to vegetation studies in othe5r tropical mountains in the resin of Malaysia.
Methodology
A Landsat-TM image taken on 8th April 1996 was used. Examination of atmospheric effects on the image was carried out by regression analyses between elevation and the remotely sensed data (Itten et al., 1992), and by histogram method (chavez, 1988). Bands 1(0.45-0.52mm), 2 (0.52-0.60mm) and 6(10.40 - 12.50mm) were strongly related to the elevation. Thus, in this study, emphasis is given on bands 3 (0.63-0.69mm), and infrared bands of 4 (0.76-0.90mm), 5 (1.55-1.75mm) and 7 (2.08-2.35mm), which did not show apparent elevation patterns.
Aerial photographs were the principal source for extracting the variables of the tropical forest; crown diameter and percentage crown cover, as well as recognition of forest types. Field surveys were carried out to investigate the forest structures under the canopy layer and to obtain the ground truth data for land cover types in general, for forest types in specific.
Contour lines were digitized for topographic map (1:50,000) and input in to a Geographic Information system as vector data. A digital elevation model ea produced from the vector deal (elevation ) for geometric correction s of though satellite image. Linear distortions of the image due to relief displacement effect were corrected, and the satellite image was transformed to the Universal Transverse Mercator projection. RMS error of the transformation before the correction was 4.56 pixels compared to 2.55 pixels after the correction.
The Landsat-TM image was transformed using tasseled cap transformation after the geometric corrections. The tasseled cap transformation generates spectral features (brightness, greenness and wetness ) that are well known for their relationships with physical characteristics in a satellite image (Crist and kauth, 1986). It was applied in this study because the spectral features can be directly related to the forest variables.
Instead of applying an inappropriate radiometric correction, classification is desired to assure relative homogenous illumination. In this case, since the sum azimuth during the satellite overpass (86.6°) was almost identical to the East (90°), slope-aspect of the image can be classified into four slope-aspect classes; east (42°-131°), south (132°-221°), west (222°-311°) and north (312°-41°). Slope -aspect with in the definition of east slope plots were identified in the satellite image and the mean digital number (DN) was extracted from each plot located in the east slope-aspect class for analysis.
The topographic effect within the east slope-aspect class was assessed by regressing cosine of incident angle (topographic parameter ) with the Landsat-TM data. There is no evidence that the remotely sensed data used in this study (east slope-aspect ) were influenced by the topography effect.
Analysis and Discussion
The spectral response (DN) were examined in a tasseled cap feature space. Plane of vegetation is defined by the features of brightness and greenness, as x-axis and y-axis, respectively (figure 1). In this plane, trajectories in response to the change in the percentage crown cover wore observed. With high brightness and low greenness, bare soil is located in the lower right part of the feature space. With increasing percentage crown cover, the vegetation pixels traverse from the lower right part of the plane to the group of pixels with closed in the upper left part of the plane.
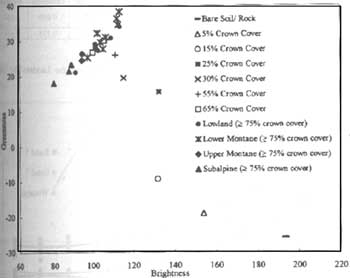
Figure 1. Plane of Vegetation
In the upper left part of the feature space, influence of the crown diameter on the spectral response from closed forest (³ 75% crown cover ) was observed. When the crown diameter is small, sub alpine forest tends to occupy the part that nearest to the origin. In contrast, big crown forests ( e.g. lower montane ) tend to distribute farther away from the origin.
The actual relationships between the forest variables and the Landsat-TM data were investigated by regression analyses. The percentage crown cover is strongly related to all the remotely sensed data except band 4 (Table 1). Only a weak positive relationship (R2=0.27) is found between the percentage crown cover and the near infrared data. This is attributed to the influence of the bare granite and variations in the vegetation amount associated with the different types of vegetation.
| Forest variables | Band 3 | Band 4 | Band 5 | Band 7 | Brightness | Greenness | Wetness |
| Percentage crown cover | 0.847 | 0.27 | 0.951 | 0.984 | 0.809 | 0.869 | 0.984 |
| Crown Diameter | 0.607 | 0.718 | 0.587 | 0.407 | 0.63 | 0.535 | 0.691 |
In contrast, the relationships between the percentage crown cover and the near infrared bands(bands 5 and 7), and also between the forest variable andwetness are vary strong (Figure 2). This is because the increases in the percentage crown cover have led to the vegetation moisture content and the soil moisture that absorb solar radiation in bands 5 and 7. wetness is sensitive to the soil moisture and canopy moisture content (Lillesand and kiefer, 1994). The increases in the soil and vegetation moisture content due to increasing vegetation cover are clearly shown by the very strong positive curvilinear relationship between the percentage crown cover and wetness. A strong negative relationship is also found between the forest variable and band 3(R2=0.847). band 3 is designed to sense in the strong absorption region (red ) of chlorophyll and b. the increases in the percentage crown cover also mean increases in the green vegetation amount and thsis the amount of the chlorophyll.
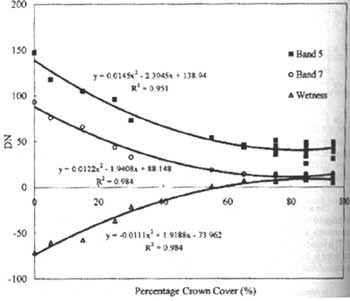
Figure 2. relationship between Percentage Crown Cover and the Landsat-TM Data (bands 5 and 7 and wetness)
The crown diameter is strongly related to band 4 (R2=0.718) in the closed forest (Table 1). The strong curvilinear relationship between the crown diameter and the band 4 data has indirectly shows the changes of forest types along the elevation gradient. The changes of forest type forest the subalpine forest (small crown ) to the lower montage forest (moderately big crowns ) cause the increases in he spectral responses forest the forest. Low spectral responses of band 4 in old growth stands with less reflective forest litter and crown shadow were reported (spanner et al., 1990).
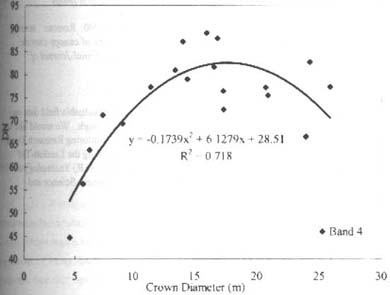
Figure 3. Relationship between crown Diameter and Band 4.
Conclusion
In short, various information on the tropical forest are contained in the satellite data and are potentially extractable for the forestry studies at a regional scale. The percentage crown cover and crown diameter are important forest variables in forest resource studies. Landsat-TM bands of 5 and 7, and wetness of the tasseled cap transformed data were found having great potential in prediction the percentage crown cover. The crown diameter is strongly related to the and 4. this study also recognized that the satellite data, aerial photographs and field survey are supplementary to one another. Over a large region, the combination of satellite data with aerial photographs and field data can be very useful to forest resource survey.
Acknowledgement
We are highly indebted to Dr. kanehiro Kitayama for his invaluable field data on tropical forest in Kinabalu Park and also his guidance during field work. We would like to express my gratitude to Dr. Haruo Sawada of the world Forest Monitoring Research Team, Japanese Forestry and forest Products Research Institute for providing the Landsat-Tm data from the Joint Research on Enhancement of remote Sensing (SAR) Technology on Global Forest Environment Monitoring Project funded by the Japanese Science and Technology Agency.
Reference
- Chavez, P.S., 1998. an improved dark object subtraction technique for atmospheric scattering correction of multispectral data. Remote Sensing and Environment, 24, 459-479.
- Crist, E.P. & kauth, R.J., 1986. the tasseled cap de-mystified. Photogrammetric Engineering and Remote sensing, 52, 81-86 .
- Itten,K.I.,Meyer,P., Kenllenberger,T.,Leu, R., Sandmeier, ST., Better, P. & Seidel, K.., 1992 . correction of the Impact of Topography and Atmosphere on Landsat-TM Forest mapping of Alpine Regions. Remote Sensing Series, vol. 18, university of Zurich-Irchel , Zurich.
- Kitayama, K., 1991. vegetatio of mount Kinabalu Park, Sabah, Malaysia, Map of physiognomically Classified Vegetaio. East-West Center, Honolulu, Hawaii, 45pp.
- Lillesand, T.M., & Kieger, R.W., 1994 (3 rd . Ed. ), Remote Sensing and Image Interpretation . John Wiely & Sons, New York, 750 pp.
- Spanner, M.A., Pierce. , Pierce, L/L/, Peterson, D.L., & Running, S.W., 1990. Remote sensing of temperate coniferous forest leaf area index: the influence of canopy closure, understory vegetation and background Reflectance. International Journal of Remote sensing, 11, 1, 95-111.