| GISdevelopment.net ---> AARS ---> ACRS 1998 ---> Education/Training |
A Multi-Dimensional View of
GIS
Abstract:
Geographic Information Systems has primarily revolved around two dimensions (2D) both for visual and spatial analysis, with the other dimentsion used sparingly for visualization or animation and time sequencing only. This paper will introduce the practical issue and will describe the development of a multi-dimensional visualization and spatial-analytical took for GIS.
Introduction
The use of three dimensional (3D) visualization techniques for both Remote Sensing and GIS integration has been widespread for quit some time now. This visualization method has been used primarily as an output medium to emphasize the multi-dimensional spatial relationships and temporal aspects of a process. In GIS, this usually takes the form of animation sequence corresponding to certain temporal processes such as growth, expansion and distribution. With remote sensing, this operation would entail draping(overlay) of graphic images corresponding to captured real world phenomena or image map derivatives over terrain models or surfaces. In general however, this visualization has been confined to the generation of fly-throughs, walk throughs in simple animation frame sequences, and limited model motion coupled with perspective viewing. The output is an end product by itself with no 'live' link either to the spatial-analytical process, the database, and the operator. Although some CAD systems have some capability in linking with external databases, most of them can only do so while in a CAD program environment.
GIS derives its power and popularity from its ability to do spatial object queries and attribution, to have links to structured databases, to do geographic analysis, and to generate colorful maps. This can be attributed to the functional and standardized design inherent in the data structure of conventional GIS's where a point can mean a stationary or non-stationary object or symbol such as houses, a line can represent linear features such as roads or rivers, and a region may represent administrative, soil and geologic boundaries. However, these GIS still do adhere to traditional cartographic methods of 2D and pseudo 3D representation, simplification, abstraction and generalization of reality. For most, this is sufficient enough.
The Pros and cons
Today, it is hard not to consider the advantages of three dimensional or even multi-dimensional systems of visualization and operation which afford us a higher level of representation and even more powerful viewing of spatial relationships among objects.
The disadvantages of having higher dimensions are its inherent compute-intensive(floating point) operations for rendering and visualization thereby requiring more expensive, faster and powerful hardware, software and operating systems. There is also the need of modifying the GIS model structure and topological representation to include this higher dimensionality in the data.
Recent advances in hardware integration, graphics software standardization, and the steady decline in costs for desktop computing technology have offered a more attractive medium for GIS visualization and Remotely Sensed Imaging. Video graphics capabilities including the most demanding rendering and imaging processes are being built-in to dedicated hardware thus freeing the (CPU) processor to do other more important tasks. RAM is increasing in capacity, getting smaller in size, and becoming cheaper. Storage devices are also faster, and larger capacities and lower costs per megabyte of storage space. These are encouraging development.
Current State of Technology
The "gaming" world has been keen in taking full advantage of these developments as can be seen in the fierce competition to provide the most "immersive" gaming experiences at the expense of achieving graphics realism and interactivity. In addition, most of these gaming technologies still use the most convenient and cheapest from of interaction and control via an on-screen output device and coupled with simple input devices such as mice and joysticks, to which most vides graphics hardware manufactures have responded with much enthusiasm.
The best efforts os far in 3 D environment are those utilizing a visualization toolkit developed the Centre for Landscape Research, University of Toronto. This toolkit is based on '3D inferenceengines' to expand and link 2D GIS feature with 3D attributes (Hoinkes and Lange). However this toolkit is only available for powerful Silicon Graphics(SCI) Workstation Computers running screen point-and-click queries so popular in conventional GIS.
There have been efforts to take this one step further and utilize Virtual Reality (VR) systems for a "full immersion" type of visualization whereby the operator participates as a first person observer, navigator and inter-actor complete with full regalia of VR goggles and/or data gloves (Parson). This is perhaps the ultimate tool in spatial visualization and interactivity, but current VR technology have yet to provide this "full immersion experience" on our desktops especially with its limited flexibility for model generation, high cost, less power and viewability. However there is a lot of promise to this technology especially with its mix of realistic imaging, sounds and video to create virtual works.
Perhaps the scientific and research community can be more involved and share in the experience of an excitement for these new technologies.
The Design and Development of a Multi-dimensional System.
The current state of technology suggests the possibility of porting conventional 2D GIS to a multi-dimensional system preserving most of the 2D GIS functionality and enhancing their visual and analytical capability with the addition of higher dimension in one integrated system at lower costs.
The task at hand is to take advantage of these new developments in imaging and visualization technologies and design a system that integrates the power and flexibility of conventional 2D GISS system and apply them to a multi-dimensional system. The system must therefore be capable of transferring the most basic and necessary functions of a GIS and in addition, include the following multi-level parameters:
- Expand the capability of conventional 3D visualization and incorporate interactive point-and-click queries and spatial analysis.
- Maintain low cost in both hardware and operating system platforms.
- Have wider audience viewability which is only possible using conventional display devices.
- Be more interactive and have real-time rendering capabilities which means that the operator must be able to navigate the world model, be capable of moving objects around, change object physical or attribute properties interactively on-screen (geocode), query for more information about these object and return other useful information from a linked database using conventional SQL method.
- Have multi-view capabilities to enable simultaneous viewing from different positions and locations
- Be capable of being manipulated down to its most basic object polygon structure to enable full control for visualization and simulation.
- Have the capability for conventional CAD object model creation, modification and control in the textural material to be used in representing the solid model.
- Be able to do object model simplification to reduce graphics rendering overhead but still maintain overall visual accuracy and interpretability.
- Be able to interface with conventional 2D GIS data formats and structure to enable an easier transition and porting of existing GIS databases.
- Have an additional function to capture real -time data such as those coming from GPS or field sensors and representing this visually in the virtual world model as moving objector animated texture maps.
- Have capability to transfer 3D coordinate values of points, lines and regions-a3D digitizer.
- Be flexible enough for any future enhancements such as multimedia support and VR devices.
Conclusion
These exciting development in visualization and computing have somewhat made us realize that technology has brought us back full circle in representing the Real World not as abstract object or symbols in paper but as we see and experience it. Perhaps in the near further we may yet develop and utilize other powerful visualization tools in our quest. So let the games begin.
Reference
- Hoinkes, R. and Lange, E. 1995, 3D for Free-Toolkit Expands Visual Dimensions in GIS. GIS World, July.
- Parsons, E. Virtual worlds technology. The ultimate GIS visualization tool? School Geography, Kingston University.
Multi-Dimensional GIS linked to attribute table and being queried on-screen
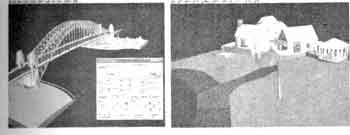
Geo View 3D capable of rendering even complex CAD Models
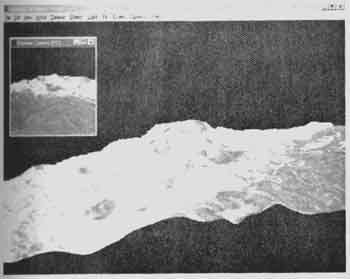
Geo View 3D with multi-look camera and overlaid satellite image over surface model