| GISdevelopment.net ---> AARS ---> ACRS 1998 ---> Disasters/Pollutions |
Characteristics of Satellite
SAR Images in the Damaged Areas Due to the Hyogoken-Nanbu Earthquake
Hisashi Aoki, Masashi
Matsuoka and Fumio Yamazaki
Earthquake Disaster Mitigation Research Center, Riken
2465-1 Miliyama, Miki, Hyogo 673-0433, Japan.
Tel: (81)0794-83-6632 Fax : (81)-794-83-6695
E-mail: aoki@miki.riken.go.jp
AbstractEarthquake Disaster Mitigation Research Center, Riken
2465-1 Miliyama, Miki, Hyogo 673-0433, Japan.
Tel: (81)0794-83-6632 Fax : (81)-794-83-6695
E-mail: aoki@miki.riken.go.jp
It is expected that clouds and smoke do not greatly affect the application of SAR in identifying the extent of damage after an earthquake. Earth observation satellites installed with SAR observed the Kobe area before and after the 1995 Hyogoken-Nanbu, japan earthquake. The relationship between the earthquake damage and the SAR images taken before and after the earthquake was investigated for the purpose of extracting earchquake damage distribution by satellite SAR images.
Introduction
SAR (Synthetic Aperture Radar) observations can be performed night and day. This feature is useful for an effective assessment of damage at an early stage following a disaster when a field survey for a large area is difficult. For gathering damage information due to natural disasters, several methods exist such as field survey, aerial photographs and television, and satellite optical sensors and SAR. A remote sensing method that uses SAR is expected to provide two-dimensional damage assessment on a large regional scale. Detection of crustal deformation by SAR interferogram (Ozawa et al., 1997) and detection of damaged built-up areas by the earthquake using SAR intensity images (Yonezawa and Takeuchi, 1998) have been reported. However, quantitative evaluations on SAR images are still few.
In this study, we attempt quantitative evaluation on the characteristic of satellite SAR image of the damage area due to the Hyogoken-Nanbu Earthquake. Data used is the satellite SAR images taken before and after the earthquake and the building damage data obtained by a comprehensive field survey. Earth observation satellites installed with SAR observed the Hanshin-Awaji area four months after the earthquake. The field survey data were digitized by building Research Institute (BRI), Ministry of Construction using a geographic information system (GIS). Quantitative assessment on the accuracy of SAR images is carried out using these two data sets on building damage.
Satellite SAR Images
The satellite SAR images used the following analysis are those taken from the ERS-1 on October 12, 1994 (before the earthquake) and May 23, 1995 (after the earthquake, shown in Fig 1). The main characteristics of ERS -1 are listed in Table 1. In each recorded image, one pixel is equivalent to a ground distance of 12.5 m. The image that was obtained in the nearest day after the earthquake is that of four months after. Because of this time difference, a direct comparison between the SAR images and the field survey data is not very accurate. However, we think that basic evaluation is still possible on the potential of the satellite SAR images to detect the changes in the earth's surface of urban areas.
| Altitude | 785km |
| Frequency | 5.3 GHz |
| Wavelength | C- band |
| Depression | 23°at midrange |
| Swath width | 100 km |
| Spatial resolution | 30m |
| polarization | v v |
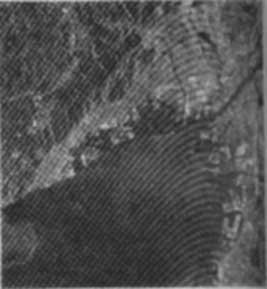
Fig.1 ERS-1/SAR image on 1995/05/23
Building Damage Data by Field Survey
Earthquake damage data used in this study were those on building damage in Kobe and the surrounding areas due to the Hyogoken-Nanbu Earthquake. A compreshensive building damage survey was conducted few weeks after the earthquake and the results of the survey were compiled by the Architectural Institute of Japan (AIJ) and the City Planning Institute of Japan (CPIJ). The compiled data set was digitized by BRI using GIS. In this GIS map, building damage levels were classified into five categories: damage by fire, severe structural damage, moderate damage, slight damage and no damage. The data set contains the total number and the number of damaged buildings per each block of city district. The damage ratios evaluated for each block were used as the reference data.
Analytical Procedure and Satellite SAR Image Data Processing The procedure of this study is shown in Fig. 2. Each step of the flow is as follows:
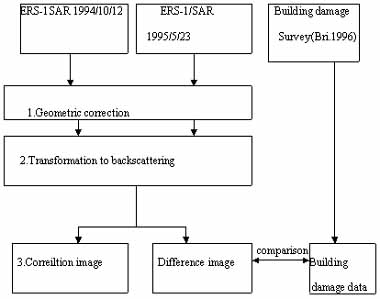
Fig.2 The flow of this study
(1) Geometric correction
A geometrically corrected image is generated through a process which uses control points on the ground having high correlation before and after the earthquake. The correlation coefficient is calculated by dividing the covariance of the two images by the dispersion of each image (Remote Sensing Society of Japan, 1992), and is expressed as
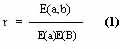
In which a and b indicate the backscattering coefficients of pixels before and after the earthquake.
(2) Transforamtion to backscattering
A pixel value of satellite SR images is transformed into the backscattering coefficient. Which is the basic physical value of the quantitative comparison of images at two time instants. The backscattering coefficient is calculated by the following equation (national Space Development Agency of Japan, 1996).
so = 20 log10 X - 65.3 (2)
(3) Correlation image
The correlation coefficient is used as a characteristic value of satellite SAR images at two different time instants. The correlation image is generated using a pixel value of the average correlation coefficient within a 5 x 5 pixel window. The correlation coefficient is calculated by equation (1)
(4) Difference image
The difference of the backscattering coefficients is also considered as a characteristic value. This difference image is generated using a pixel value of the average difference of backscattering coefficients before and after the earhquake within a 5 x 5 pixel window.
Calculated Characteristics of Processing Images
The correlation image obtained by the procedure above is shown in Fig. 3 black color indicates areas where the correlation coefficient is low. Comparing the urban area around Osaka and the forest areas, the correlation coefficient of the urban area is higher that of the forest area. The difference before and after the earthquake is considered to reflect the change of land cover. The correlation in the urban area from Kobe to Nishinomiya is slightly lower than other urban areas. The difference image is shown in Fig. 4. black color indicated area where the difference of the backscattering coefficients is significant. A black zone is seen conpicuosuly in the urban area stretching from kobe to Nishinomiya.
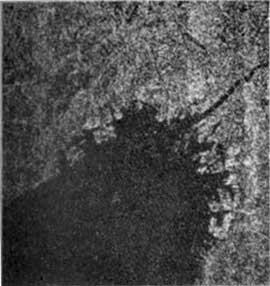
Fig.3 Correlation of the intensity images before and after the Hyogoken-nanbu The Hyogoken-nanbu earthquake
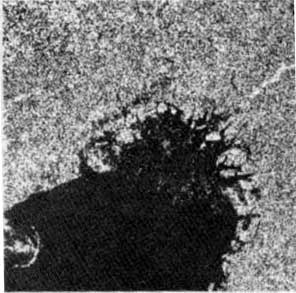
Fig. 4 Difference of backscattering cofficient Obtained from SAR images before and after the Hyogoken-nanbu earthquake
Characteristics of Satellite SAR Images in the Damaged Area
The correlation image and the difference image are compared with the damage ratio of buildings evaluated from the field survey data. The severe damage ratio is defined as the ratio of the number of seriously damaged buildings to the total number of buildings within a district block. The relationship between the average difference of the backscattering coefficients and the average correlation coefficient for different severe damage ratio, D, is shown in Fig. 5 the mean values and the standard deviations by the correlation analysis are listed in Table 2.
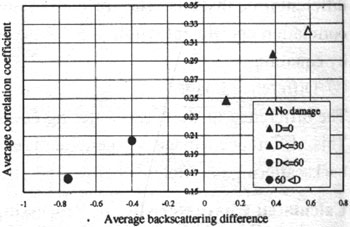
Fig.5 Relationship between the average backscattering difference and the average correlation coefficient
| Correlation coefficient | Backscattering difference [dB] | |||
| Server damage ratio D(%) | Average m | Standard Deviations | Averagem | Standard Deviation s |
| No damage | 0.32 | 0.27 | 0.59 | 1.38 |
| D=0 | 0.30 | 0.26 | 0.38 | 1.40 |
| D£30 | 0.25 | 0.26 | 0.12 | 1.44 |
| D£60 | 0.20 | 0.27 | -0.40 | 1.72 |
| 60<D | 0.16 | 0.27 | -0.75 | 1.96 |
Nodamaged areas indicate the pixels where the houses have no exterior evidence of damage due to the field survey. The results show that the difference of the backscattering coefficients becomes high and negative and the correlation coefficient becomes low in the area of a high severe damage. On the other hand, in the area of a low severe damage. On the other hand, in the area of a low severe damage ratio, the difference of the backscattering coefficients becomes high and positive and the correlation coefficient becomes high. However, since the standard deviations of the above two values are quite large, a large amount of randomness is included in the damage identification based on the method using the two values.
Generally, artificial structure show comparatively large reflection because of the specular characteristics of the structure and the ground. Open space has comparatively small reflection because of its smooth surface. Following the earthquake, structures were destroyed and removed leaving the plain exposed. Therefore, it is considered that the backscattering intensity taken after the earthquake is surface exerts an influence on the decrease of the correlation. It is desirable that the difference of the backscattering coefficients of the nondamaged area become zero. However, the results were somewhat different due to the following reasons:
- The observation conditions at the two time instants are not the same. For example, the satellite orbit is not necessarily equal for the two instants.
- Even in a nondamaged area, there is a change in earth's surface whether covered by building or vegetation.
- There is slight influence from the atmosphere.
- Accuracy of geometric corrected images
The relationship between the building damage area by the field survey and the satellite SAR images revealed the trend regarding the severe damage ratio. The trend in the area of a high severe damage ratio was obtained when the difference of the backscattering coefficients becomes high and the correlation coefficient becomes low. We tried to extract damaged area by calculating the correlation coefficient and the difference of the backscattering coefficients. The areas corresponding the severe damage ratio larger than 60% and the areas of nondamaged were selected because these areas exhibit the biggest difference in the relationship between the correlation coefficient and the difference of the backscattering coefficients. A linear discriminate analysis is used to classify the areas, and the result of the classification is shown in fig. 6. The building damage distribution by the field survey is damaged buildings. The comparison of the two figures indicated that the classification result from the satellite SAR image almost corresponds to the severely damaged areas by the field survey.
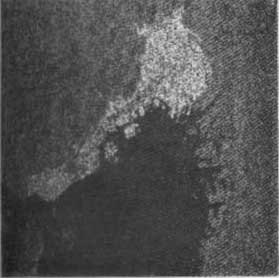
Fig. 6 Classification result that allocated Areas of the severe damage ratio larger 60% and the areas of nondamaged by satellite SAR images
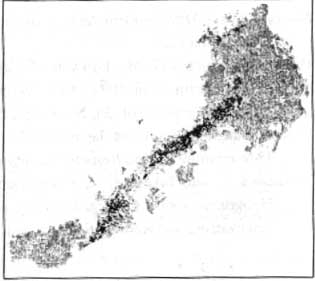
Fig7 Distribution of hard -hit areas based on building damage data by BR1
Conclusions
This paper reports on quantitative evaluation about the characteristic of satellite SAR images of the damaged area using images observed before and after the 1995 Hyogoken-Nanbu Earthquake. As a result, the relationship between the building damage ratio of a district block and the satellite SAR images was found to have a trend regarding the severe damage ratio. This trend in the area of a high severe damage ratio was obtained when the difference of the backscattering coefficients becomes high and the correlation coefficient becomes low. These results suggest that the changes in the earth's surface resulted from severe building damage within a particular area. One possible explanation is that hard-hit areas became open space from the result of building removal at the time of satellite SAR observation, four months after the earthquake. The result from area classification using this trend almost corresponded to the actual severely damaged area by a field survey. In spite of this good agreement regarding the mean characteristic of satellite SAR image, a large amount of randomness still exists in each classification category. Hence, Further study it necessary until a practical use of satellite SAR images for earthquake damage surveys in urban areas.
Acknowledgment
ERS-1/SAR images used in this research are owned by the ESA and used in cooperation with the National Space Development Agency of Japan.
Reference
- Building Research Institure (1996). Final Report of Damage Survey the 1995 Hyogoken-nanbu Earthquake (in Japanese).
- Japan Society of Photogrammetry and emote Sensing (1998). Synthetic Aperture Radar Image, Asakura Publishing (in Japanese).
- National Space Development Agency of Japan (1996). JERS SAR/ERS AMI IMAGE Data Format Manual.
- Ozawa, S., Murakami, M., Fujiwara, S., and Tobita, M. (1997), Synthetic aperture radar interferogram of the 1995 Kobe earthquake and its geodetic inversion, Geophysical Research Letters, vol. 24 No 18, pp2327-2330.
- Remote Sensing Society of Japan (1992). Illustration Remote Sensing, Japan Society of Photogrammetry and Remote Sensing (in Japanese).
- Yonezawa, c. and Takeuchi, S. (1998). Detection of Damaged Build-up Areas by the 1995 Hyogoken-Nanbu Earthquake using Ers-1/SAR Intensity Images, Photogrammetric Engineering and Remote Sensing, Vol. 37 No. 4, pp57-61 (in Japanese)