| GISdevelopment.net ---> AARS ---> ACRS 1998 ---> Disasters/Pollutions |
Remote Sensing and GIS
Application In Oil Spills Risk Assessment
Shattri B Mansor and Tee Tuan Poy
Department of Civil Engineering
University Putra Malaysia
E-mail: Shattri@eng.upm.edu.my
Shattri B Mansor and Tee Tuan Poy
Department of Civil Engineering
University Putra Malaysia
E-mail: Shattri@eng.upm.edu.my
Abstract
This paper discusses the work done utilizing remote sensing and GIS technologies to develop an Oil Spill Risk Management System. Oil spill data, access and protection information will be placed in GIS and interfacing it with a relational database for rapid access, retrieval and query. The remotely sensed data were used to derive valuable information about marine water pollution; especially on oil spillage. The remotely sensed data including LANDSAT TM and SPOT were integrated in the GIS based Oil Spill Risk Management system for Malaysia coast in order to detect, assess the risk and handle the oil spills problem in an alert situation. Various information can be retrieved from this system such as location of oil spills, quantity of oil spills, distribution in the affected area; for example location of the areas of heaviest contamination, the length of shoreline affected by the oil slick. An oil slick movement model was incorporated into this system in favor of predicting the oil slick movement direction and duration to reach the shoreline. Wind, wave and current are the main parameters for this model. The GIS-based system can be used to establish the appropriate response and locate the dense areas in a slick and local surveillance, to permit clean-up vessels to detect the oil to be cleared in rapid circumstances. This risk management system will allow new opportunities for multiple resource planning, permit viewing of the stat's natural resources in ways out therefore realized, improve the decision-making process, and provide a baseline for future assessments.
Introduction
Oil spills incidents due to accidental or intentional occurred in Malaysian water are increased over the year. The major source of spills occurs are from oil production at offshore, tanker accidents and discharge at port as stated in DOE (Department of Environment) Report, (1995). The oil spill risk is estimate higher at the Peninsular Malaysia coastal area. In the Straits of Malacca, the high level of shipping plying in a narrow and shallow navigational channel generates the risk.
This paper discusses the work done utilizing GIS and remote sensing technologies to develop an Oil Spill Risk Management System at Malaysian coastal area. Which would provide a real time and low cost system for detecting oil spill, and assess spillage risk in Malaysian water. The System is made of three sub-systems, that is, (i) Detection and Monitoring, (ii) spatial database, and (iii) Prediction. Oil spill data, access and protection information will be placed in GIS database and interfacing it with a relational database for rapid access, retrieval and query. The remotely sensed data as spatial data input were used to derive valuable information about marine water pollution, especially on oil spillage. The remotely sensed data including LANDSAT TM, SPOT Panchromatic and MSS (Multi Spectra Scanner), and air-borne images were integrated in the GIS based oil spill risk management system for Malaysia coast in order to detect, assess the risk and handle the oil spills problem in an alert situation. Various information can be retrieved handle the oil spills problem in an alert situation. Various information can be retrieved from this system such as location of oil spills, quantity of oil spills, their distribution in the affected area; for example location of the areas of heaviest contamination, the length of shoreline affected by the oil slick. An oil slick movement model incorporated into this system in favor of predicting the oil slick movement direction and duration to reach the shoreline. Wind, wave and current are the main parameters for this model. The GIS based system can be used to establish the appropriate response and locate the dense areas in a slick and local surveillance, to permit clean-up vessels to detect the oil to be cleared in rapid circumstances. This risk management system will allow new opportunities for assessment, multiple resource planning, permit viewing of the state's natural resources in ways out therefore realized, improve the decision-making process, and provide a baseline for future assessments.
Methodology
Data Availability and Acquisition
The primary data available for this study were historical of oil spills obtained from DOE (Department of Environment). LANDSAT TM and SPOT Panchromatic and MS data were provided by MACES. Peninsula Malaysia basemap with a scale of 1:500,000 was obtained from Surveying and Mapping Department. Other important sources of data such as shoreline natural resources, castal landuse, etc. were collected from documented papers and related. Remotely sensed data were processed using PCI's EASI/PACE and exported to the database for modeling.
Geographical Information System
Physical maps of Peninsula Malaysia with scale 1:500,000 were used a base map for the thematic layer and registration of each processed image. Spatial and non-spatial data were analyzed through various functions of GIS techniques, such as vectorization, rasterization, data analysis and overlaying, and modeling to yield the risk management system as thematic layers (Map composition). In this study, a PC based SPANS GIS was chosen.
Oil Spill Trajectory Model
A simple linear oil spill trajectory model was customized into the GIS environment. The velocity and direction of winds and currents are the parameters. An oil slick always be under influence of both parameters, hence the present drift prediction is based on these combined effects.
Oil slick movement = 0.033 Wind + 0.56 Current
V = 0.33Vw + 0.56Vc
The evaluation of the direction and magnitude of the resultant force of wind and current acting on an oil slick utilized information on the direction, and velocity (Vw) of the average monthly wind as well as the direction, and velocity (Vc) of the prevailing currents.
Result and Discussion
Description of Oil Slicks on the Images
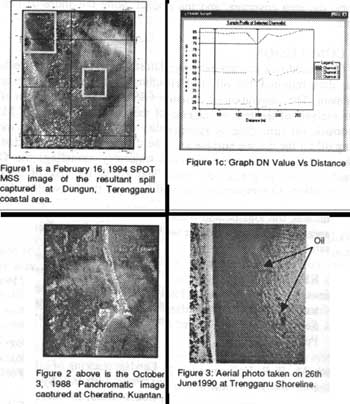
Analysis from the archive images include aerial photo showed that only the scenes acquired on 25th Feb. 1994, 03rd Oct. 1988, and aerial photos possess slick that could be decisively detected the dark spot and linked to the spill sources. The composite images of SPOT MSS and Panchromatic for the spill in the sea are shown in figure 1 and figure 2.
Generally, oil spills verification has based on two main parts:
- Detection of dark spot - Locate all dark spots that can possible be oil slicks in the image and extracted the features. The dark sport are then classified into possible oil slicks and "look-alike" based on the extracted features. Verification of dark spots is based on adaptive thresholding. This thresholding is based on an estimate of the typical grey level (DN value). The adaptive threshold is set and moved across the image in small steps to threshold all pixels in the scene.
- Feature extraction - For each dark spot, a set of features is computed. The features constitute of general, standard descriptions often applied for regions, and additional features particularly suited for oil slick detection. Examples of features are the contrast of the dark spot area to the surrounding sea, and the shape of the spot. These features are then calculated for each of the dark spots in order to determine the total area of oil spills by detector.
Oil Spill at Tenggol Island
According to the historical incident, the main source of the spilled oil was from the terminal platform at east of Tenggol island (4o 15'N, 103o 31.4'E). the winds and current were tended to carry the oil in southwest direction along the coast, and a tentative interpretation of the oil slick features is marked on the figure 1. the result shows that largest uncertainty darker spot of the spilled oil was concentrated on the upper left corner and middle lower right area. It could be a naturally occurring smooth portion of the sea under winds, or it could be possible of cloud shadow. The oil slick appears as dark stripe on the image. Their darkness is believed to be caused by few phenomena; the oil dampens the capillary waves, thus reducing reflectance, and the oil acts as a color filter on the water, thereby reducing incident and reflected radiation to the detectors of the MSS (Deutsch & Estes, 1980)
In order to verify the darker area as an oil slick, reflectance thresholds must be selected from these areas that will discriminate between the oiled areas and the ambient sea conditions. The frequency distribution of reflectance in the dark spot area was calculated and plotted as shown in figure 1c. Reflected function DN value of oil slick is lower than the surround water as can be read from the profile graph.
Oil Spill at Cherating Shoreline
Figure 2 depicts the distribution of oil along the Cherating - Kuantan shoreline. This image was taken on 3rd Oct. 1988 under a very good weather condition, where the cloud coverage of scene is estimated 0% for the whole scene. The oil spill incident occurred two days later located at (3o 44.3'N, 103o 52'E) and is 19 km nearby Kuantan. A large swirl of oil about few km long had shown as visible result. The result reveals numerous slicks throughout the entire offshore area and shows large slicks reaching almost to the shore of Kuantan.
Oil spill at Terengganu shoreline
Figure 3 is an aerial photo taken on 26th Jun 1990 at Terengganu shoreline. The main part of the oil is clearly visible and the lighter oil appears to have spread to the southern and western boundaries of the scene. The bright reflectance value on the right side of the scene indicates that the sea in this region has no floating oil on it.
The Oil Spill Risk Management System
Figure 4: Oil Spill Risk Management System (OSRMS) Functionality
The OSRMS constituted from the integration of RS & GIS consists few procedures (figure 4). They represent different operation types or steps in the system. The functionality of the procedure is as follows:
Remote Sensing Monitoring. The objective is to inform the user about environmental emergency situations. Remote sensing data from the geographical area of interest is analyzed as the data enters the system. If a possible emergency is detected, the remotely sensed data is put into a geographical context and a map mask delineating the emergency area. Then remote sensing image data are sent to the core system for further analysis.
Assessment. If the operator can confirm a possible disaster situation, the system is switched to the assessment step. The objective of this step is to verify the disaster situation and assess how serious it is Risk determination criteria is based on the oil slick movement prediction that could be predicted from the Oil Trajectory model. If the slicks impact any environmental sensitivity areas or shoreline, it can be defined a high risk of the spillage. However, there is low risk situation when the slicks moves away to offshore.
An aircraft may be directed to the area based on preliminary report from the system giving the location and extent of the emergency. The system integrates geographical, meteorological and ancillary information, combines it with a report from e.g. an aircraft when it arrives at the emergency area.
Assistance. This step is for management support of an operation to reduce or eliminate the emergency situation and its environmental consequences. It includes two -way communication with the field operation and tools for continues planning of the operation. Among the planning tool is a stimulator for different scenarios of the emergency development. The simulator will make it easier to make strategic decisions for operations trying to limit the emergency.
Information. Various organisations and the public may be informed initially and later on the development of the situation. The system will make reports semi-automatically for specially predefined recipient group.
Oil spill Trajectory model. Based on the available information of oil spilled the open sea and various meteorological information. The oil spill model is able to predict the trajectory, the area coverage, and the duration of impact along the shore of Peninsular Malaysia.
Conclusion
GIS-based risk management system uses the latest spatial information technology to store data required for oil spill risk assess, response, planning, training and risk management. The integration of remote sensing with GIS techniques offers an effective tool for analysis of the risk management. Analysis of the image of the SPOT MSS and Panchromatic oil spill clearing demonstrated the utility of satellite data as a means of detecting oil on the marine surface and of assessing the distribution of the oil that issued from the incident. With the integrated Oil Spill trajectory modeling, the OSRMS could aid the user to predict the movement of oil and assess the risk of slick in an efficiency and alert situation. Consequently, this will improve the conventional oil spill response system.
Acknowledgement
The authors acknowledgement the financial support of IRPA funds from the Malaysian Government, the logistic and other support from the University Putra Malaysia, research assistance and graduate students working on the various aspects of the project to make it successful.
Reference
- Brussieux, M. and G. Masart. (1994). Oil on the sea: application of pattern recognition techniques to thermal infrared and SPOT images. In: Massin, J.M. (ed). Remote Sensing For the Control Of Marine Pollution. Plenum Press New York, USA. Pp: 193 -199.
- Deutsch, M.R.R. Vollmers, and J.P. Deutsch. (1980) . Landsat tracking of slick form the 1979 Gulf of Mexico oil well blow-out. Proc. 14th Intl. Symposium on Remote Sensing of the Environment, San-Joe, Coasta Rica, 23-30 April 1980.
- DOE Report. (1995). http://www.jas.sains.my/doe/egra5/html/
- El-Raey, M., A.F.A-Kader, S.M. Nasr, and H.I.El-Gamily. (1996) Remote sensing and GIS for oil spill contingency plan, Ras-Mohammed, Egypt. Int. J. Remote Sensing. 7(11), 2013-2026.
- Hurford, N. (1989) Review of remote sensing technology. In: Lodge, A.E. (ed.). The Remote Sensing Of Oil Slick. John Wiley & sons, Great Britain.
- Wald, L., J.M. Monget, M. Albussion and H.M. Byrne. (1984). A large scale monitoring of the hydrocarbons pollution from the landsat satellite. In: Massin, J.M (ed). Remote Sensing For the control Of Marine Pollution. Plenum Press, New York, USA Pp : 347-358.