| GISdevelopment.net ---> AARS ---> ACRS 1998 ---> Disasters/Pollutions |
Suceptibility Mapping Technique:
An Application of Remote Sensing and Geographic Information System (GIS): A Case Study in Sto. Tomas-Marela River, Mt. Pinatubo, Zambales, Philippines
Rolando 1. Calomarde
Mines and Geo-sciences Bureau
Regional Office No. VI
IIoilo city, Philippines
An Application of Remote Sensing and Geographic Information System (GIS): A Case Study in Sto. Tomas-Marela River, Mt. Pinatubo, Zambales, Philippines
Rolando 1. Calomarde
Mines and Geo-sciences Bureau
Regional Office No. VI
IIoilo city, Philippines
Introduction
General
Many wonder why the Philippine archipelago has always been the target of natural disasters. Although blessed with natural resources, the islands are geographically situated in the so-called Circum-Pacific Rim of Fire. From the two hundred twenty volcanoes (220) volcanoes scattered in the whole country, twenty-two were classifed as active. Prior to its 1991 eruption, Mt. Pinatubo is considered dormant from its silence for the past four centuries (Tayag, 1991). Normally at the advent of rainy season, soft and unconsolidated fine-grained materials are eroded and flowed down in an unprecedented speed forming mixtures of volcanic materials and water at various amount. These materials known as lahars, inundate and bring morphologic changes along its route, not to spare the Marella - Sto. Tomas River system.
Several sensitive environmental issues and concerns, not to be overlooked, includes the possibility of prolonged flooding caused by destruction of the drainage system, severe and vast damage to properties and lands particularly on agricultural areas and the discharge of ashfall and sediment-rich river into coastal areas which support aquaculture and fisheries resources.
Scope of work
Sto. Tomas-Marella watershed is considered due to its interesting and dynamic geomorphic processes, geomorphic development and terrain changes brought by lahar flows. This work proposes to document and analyze geomorphic changes particularly on the southwest portion of Zambales and the massive yet rapid sediment input on the shore of Sto. Tomas area.
The scope of the study is limited by its objective.
Aim: to explore the applicability of satellite remote sensed data in the contest of GIS; for monitoring and detecting landform changes and ultimately prepare susceptibility map to minimize the vulnerability of elements at risk, and subsequently formulate guidelines for mitigating measures.
Research Methodologies
To come up with input thematic maps, techniques such as those employed by Verstappen, H.Th. (1983) and method suggested by Zuidam, R.A. (1986) and Meijerink, A.J. (1988) will be used for geomorphological and terrain analysis classification. Data analysis manipulation will mainly involve the use of GIS. Susceptibility analysis will be done by deterministic approach. Computer-aided aereal calculation as applied in landslide hazard zonation will be used but adopted to the specific problem at hand.
The main gist of the research will involve the extensive use of multi-scale and multi-temporal aerial photos, satellite imageries, existing topo maps and other relevant materials (Fig. 1.4). GIS software used is ILWIS Ver. 1.5.
Location of the Study Area
General
The study area is situated on the western side of Zambales Province, western Luzon, Philippines. It is within 183000 E to 214000 E and 1651000 N to 1669000 N UTM zone. From Manila, it is connected by well-paved road at 210 km. Distance (Fig. 2.1). The Sto. Tomas Plain is 26 km. Wide east ot west and 13-km. Wide north to south The province is composed of six municipalities with Castillejos and San Marcelino as the busiest. The other towns are San Narciso, San Antonio, San Felipe and Sta. Fe. All these are interconnected by primary and secondary roads.
The area of interest is along the western flank of Mt. Pinatubo. The uppermost headwater comes at 20 ks. From the crate. The headwater area is drained by deeply incised and moderately narrowed channel Marella and Mapanuepe River. Bedload and channel materials of these rivers are drained in a west-southwest direction towards the South China Sea.
Regional Climatic Setting
The normal climatic condition on Central Luzon is characterized by well-defined wet and dry seasons. On the west side, the dry season lasts from November to april with the rainy days from May or June to Octomber. About 80% of the 3,900-mm of annual rainfall in Zambales are conveyed by the southwest monsoon (fig.2.2). Form the raingauges installed around Mt. Pinatubo, those located proximal to the volcano received more precipitation than those of the distal raingauges (PHIVOLCS, 1995). This strongly indicated the presence of a stronger and more intense rainfall near the volcano, attributed to the effects of topography. It is dominated by steep and mountainous terrain.
Landuse and Landcover
The geomorphologic setting and lithologic variations in Mr. Pinatubo suit the different landcover, typical of a humid-tropic-influenced topography. Along the slopes, the terrain is patterned with different landcover and with distinct landuses. Prior to the eruption, the rugged and deeply dissected slopes were densely forested with protions largely cultivated with rootcrops. Owing to the lithologic characteristics, the rounded-crested hills of andestic composition are barren and void of forest cover. In contrast, the flat to slightly sloping portions associated with lahar terraces is extensively utilized as sugarcane plantations.
Settlement and built-up areas are located on the broad Sto. Tomas Plain with the deltaic portion at the lowest part of the plain used as fishponds and aquaculture.
Geology and Topographic Setting
General Geology
The study area is partly within the Zambales Ophiloite complex consisting of Masnloc, Cabangan and San Antonio massif ( Yumul et al., 1991). North and south of Sto. Tomas plain, the topographic highs are mostly peridotites and gabbros forming distinct peaks of Mt. Pimmayong and Mt. Maubanban. Javelosa (1985) pointed out that the prominent moderately dissected hills are composed of undifferentiated volcanics ranging from andesitic to dacitic flows. At the northeast side, quatemary pyroclastics dissects the underlying rocks. These are sequence of pumice-bearing volcanic breccia, lava and ash flows (Fig. 3.1). The west coastal portion is limited by 5.0-m. high beach rides and swales complex consisting of medium-grained clastic materials from the volcano.
Topography
At the upper central flank of the volcano, the slope are moderate having deep valley incision by radial network of drainage. Valleys at the upper slopes were deep, narrow and U-shaped and were steep and step-like in longitudinal profile. At the lower reaches, the valleys were gently sloping, concave-upward profile with broad generally shallow banks flanked by multi-level river terraces about 5-10 m. high. Most of the upper drainage was buried by pyroclastic flows during the 1991 eruption, and subsequently lahars have aggraded the lower reaches almost to the level of the highest terraces.
Pinatubo Drainage Systems
Sto. Tomas-Marella River System
This river system stretches to 43 kms. From the summit. Marella river trends southwestward then joins the Mapanuepe River in the vicinity of Dalanawan forming the Sto. Tomas River Below this junction, the river flows along the southern margin of a broad alluvial plain. The southern edge of the plain is marked by irregular courses of the Pamatawan River. The eruption and subsequent rapid erosion and degradation of pyroclastic flows during the rainy season, has made Marella River down to the junction of Mapanuepe, a natural debris basin for lahar deposit.
Pre-eruption morphology of the river (9176 AP) was braided in nature, and dendritic by aggrading rivers after the eruption. The present riverbed of Sto. Tomas is higher than the floodplain, thus, overbank spills and channel avulsions are now common along its entire length (MGB, 1991).
Sto Tomas Plain
The plain is about 13 x 26 kms (Javelosa, 1985). It resulted from the depostion of sediments from Marella River, Mapanuepe River and headwater of Sto. Tomas. Most of the sediments are the volcanically derived alluvial materials of loosely compacted gravel and sand.
At least 140,340 people (1991 Census) are scattered along the major towns and barangays.
Geomorphology Based on Terrain Mapping Units (TMU)
General
The geomorphology was delineated based on the characterized terrain mapping units focusing on its drainage densities, slope steepness and internal relief. Guided by works of Meijerink (1992), identification and construction of the geomorphology were based on the interpreation of multi-scale aerial photographs. Also considered are the lithological parameters, which are important in molding the present landforms.
1976 Pre-eruption TMU
The geomorphologic characteristics were interpreted using the 1976 aerial photos (scale 1:18,000). At least fifteen terrain units comprise the pre-eruption morphology of the area. Fig. 5.2 shows the TMU's map as listed in Tables5.2 the pre-eruption geomorphology is divided into six (6) broad landform classification, i.e. structural and denudational, fluvio-volcanic, volcanic-denudational, volcanic-fluvio, fluvial and marine-structural.
The highly dissected hills (hdh) were underlain by the undifferentiated volcanics comprising of volcanic bombs, lailli and breaccia. The terrain is conspicuously segregated from the rest based on the high concentration of gullies along its flank, noably south of Mt. Bagamo. Parallelism and degree of dissection of gullies along the valleys indicate ho,ogeneity of the lithology.
The steep-sided short slopes are within the dacitic/andestic volcanics on the western slope of the volcano. With the slope at >20%, these volcanics have pointed peaks and semi-radiating but shallow gullies. Mass movement is relatively active as indicated by several escarpments and fault-scarps on the west-facing slopes. The terrain is heavily criss-cross by structure-related NE-SW lineaments.
The less dissected hills were dispersed on the northern portion and comprised the relatively recongnizable units, those of short slopes and another with long slopes. The mountainous topography exhibit parallelism of ridge and valleys, geologically controlled stream valleys with rectangular drainage patterns and knife-edged prominence of structural crestlines with peaks varying from 101 to 1,071-m ASL.
Chorley (1986) emphasized that terraces are generally remnants of floodplains trenched by river responding to base level change. The pre-eruption terraces were grouped based on their lithological and morphological differences. Steep risers that separate terraces are at the range of 1.0 m to 5.0 m.
The whole Sto. Tomas Plain is mantled by volcaniclastic materials in the form of a fan. With its head ion the confluence site, the materials were distributed southerly and northwesterly along the Sto. Tomas River. The fan is delimited by the uplifted mountain ranges on the south and north of the area.
The elongated beach ridges and swale complex are not exactly aligned with the present Zambales coastline. The broad lahar fan is limited by the blockade of these landforms, thus, preventing them from overflowing into the sea. From aerial photos, the plain is marked by fan-shaped morphologies of depositional lobes and crevasse splays.
Post-eruption TMU
Delineation of TMU's was based on the interpretation of the 1991 AP (1:15,000). The pyroclastic flows were remobilized to the lowlands in the form of lahars as the Sto. Tomas-Marella channels where significant changes have taken place. The pre-eruption units as previously described have been buried completely by lahar flows. The terrain units were tabulated (Table 5.3 and Table 5.3a) and shown in map form in Fig.5.3 and Fig.5.3a. The voluminous amount of lahars stared to deposit at 300-m ASL constricted by Mr. Bagamo (UTM 209000, 1665000). Erosion of pyroclastic deposit continue at the upper reaches of Marella, rapidly flows downstream as lahars and scours, fill-up and occupy most of the pre-eruption channels. Overbanking of lahars is not uncommon along the stretch of Sto. Tomas river especially during the initial development of lahar channels. These overbank flows can be distinguished in AP's forming a small overbank along the lahar channels. The 1991 lahar deposits occupy an area of ~41.5 sq.km. with a general slope gradient of ~2% (Fig. 5.3b)
Formed at the confluence site between the Mapanuepe and Marella river, lahar delta has an area of 0.83 sq.km. and an average thickness of 1.0 to 5.0m. the delta rapidly increases in size as lahars from the upstream of upstream of Marella divert their load towards the SSE direction, thus creating a temporary lake by damming the outflow of Mapanuepe River. The break in slope towards the confluence strongly influenced the formation of the lake, with the presence of Mt. Bagang along the lahar route, and immediate narrowing of the channel to 100m. During the rain season, aggradation at the confluence increased much faster than the rising water level at Mapanuepe resulting in the development of the lake. The lake has an are of 5.25 sq.km. with water level reaching at ~116.0 m. ASL. Rapid increase in the water level up to >120 m. ASL caused an overflow of the lake in 1992 crating flood on the low-lying areas. An artificial output on the WNW end tip of the lake is constructed primarily to maintain the water level and prevent any lake-failure related lahar. The 1992 LANDSAT-TM color composite reveals the return of vegetative lire as plants, trees and grasses slowly appear along the pre-eruption surface.
Slope and TMU Changes
From Table 5.4/Graph5.4 and Table 5.4a/Graph 5.4a, an increase in the flat to gently sloping terrain is compensated by an equivalent decreasse in slope. Lateral dispersion of sediments caused by breaking and overtoppin of the unarmored dike immediately filled up stream channels in the plain. The filled up channel in the downstream side of Sto Tomas river had increased the preoeruption bhannel by 5.0 to 20.0 m. ASL. The presence of Mt. Bagang at the confluence site prevented the direct inflow of sediments to Sto. Tomas River. The build-up of the materials severely increased the slope gradient. The lateral encroachment and deposition of the eroded sediments from upper Marella slope gradient. River Valley abruptly changed the terrain features. Changes were mostly in terms of aereal distribution and relative position of the units. A decrease from the pre-eruption lahar area in 1991 and a slight increase in 1992 can be attributed to the lose and unstable nature of the sediments.
Post-eruption Shoreline Morphology
The 1976 AP showed the debouchure of Sto. Tomas River is clogged (Fig.5.5). Thus, from the AP's taken five months after, it showed that sediments immediately fill up the river. Heavy to moderate precipitation triggers the sudden inflow of sediments coming from the footslope of the volcano. The former braided-type channel morphology is re[placed by meandering pattern. Generally, the confinement of sediments by the dike more of less directed the channel to go on straight pattern. Since lateral aggradation dominates, the channel widens to a certain extent. Average width of the river channel in the vicinity of Brgy. San Rafael and Brgy. Sta. Fe increased by as much as 1500m.
Progradation along the reiver delta is very prominent. In 1993 SPOT-PAN image, a suddent increase at the mouth of Sto. Tomas and coastal portion has been noted. In 1995 SPOT-XS image, progradation of filling up is expected due to the rapid increase in the sediment input. This is caused by the voluminous loose pyroclastics made available for reworking by fluvial and lahar processes. Updated reports(PHIVOLCS, 1995) indicate that sedimentation offshore is decrasing. The slow and decreased rate of progradation maybe due to reduced sediment discharge; sediment distribution at the mid-section is diverted towards Sta. Fe or towards the confluence site or either part of sedimentation is towards the southeast.
Newhall (1994) predicted that Mt. Pinatubo's sediment yield (Graph 5.5) will be until 2010. At this time, erosion is most likely to happen in segments that will be exposed to more progradation, such that the Sto. Tomas River delta.
Remote Sensing: Lahar Change Detection
Methodology
Visual interpretation, three-date color composite and density slicing comparison techniques were used. The use of moderately scaled AP's (1;18,000.1:25,000) and 1;50,000 topo maps were vital in the interpretation of the satellite images. The generalized schematic diagram of the procedure is presented in Fig.6.1.
Image Interpretation
Table 6.2/Fig.6.2 illustrates the three-date color composite, which presents major area of change and no change. The black and white color indicates no change as shown by some protions of the vegetated area (V). Chromatic colors such as blue, yellow, cyan, magenta, red and green denote areas of change. Change from 1991 to 1995 is indicated by red and cyan. Red shows the highly silted tailings pond used by Dizon Mines, and the hyperconcentrated streamflow lahar channels along the Sto Tomas river. Red also show the water areas in 1991 now replaced by laharic deposits. The adjoiningedge of the major debris flow presents a viable example. Cyan shows the additional land area and vegetation cover that was submerged due to the growth of the lake. Likewise, it is manifested by the watered agricultural area on the lowlands, some vegetation areas under shadows. Cyan along the edge of the lake represents the growth and expansion from 1988 to 1995.
Blue, green yellow and magenta represent areas that changed twice from 1988 to 1995. Blue is typically represented by land or vegetated areas submerged under water. These are the lands is typically represented by land or vegetated areas submerged under water. These are the lands submerged by mapanuepe Lake in 1991 rainy season. Green areas show scarce vegetation or bare soil to healthy cogonal grasses and back to scarce vegetation or bare soil. Both green and yellow represent areas with abrupt changes from 1988 to 1995. These changes are represented by the leading edge of the major lahar debris flows along the Sto. Tomas river in 191 and the thick ash deposits on the scarcely vegetated Mt. Pimmayong. Magenta could be displayed by vegetation I which reflectance response possibly returned to a high value. Other possibilities of magenta could be regrowth areas along the slopes and lowlands, and the pyroclastic flows on the upper reaches of Marella.
The three-data color composite from density sliced SPOT-XS images as shown in Fig.6.2a was alternately used for interpretation. Band 1 of 1991, 1995 and 1988 were combined using RGBcolor assignemtns, respectively. The white (upstream of Sta. Fe River and soil cover in the plain) and back (vegetation in the Sto. Tomas Plain and the vast forest cover) areas show no change from 1988 to 1995. Red represents enhanced features in 1991 image, green in 1995 is shown by the intense yellow from image. More lahar debris flows aggradation from 1991 to 1995 is shown by the intense yellow from the upstream of Marela River to Sto. Tomas (reaching the vicinity of Brgy. San Rafael, going south-southwest). Cyan represents the change from 1988 to 1995 as the entire channel had been filled up by sediments and growth of the lake. Magenta is the change from 1988 to 1991 wherein the plain had been covered by ashfall. The green features in the lower right corner of the image are cloud cover from 1995 image. But the green color at the debouchure of Sto. Tomas within the coastal areas represent lahar flows.
GIS Application: Components of Factor Maps on Lahar Distribution
For any natural hazard zonation evaluation and prediction, several spatial data layers are necessary. For scientific, accurate and near to truth prediction, these layers should be related to geology, geomorphology and topography of the area under study. Selection of appropriate data layers, which are not only meaningful, but also necessary for the specific conditions, is the most important task of any methodology dealing with natural hazard analyses.
For lahar hazard prediction, all types of information related to terrain, structures, slope gradient aspect, drainage, rainfall, seismicity, etc. should be at hand. For this particular study, some information layers are not available. Present study is being carried out at medium scale (1:50,000/1:25,000). Either it is landslide or lahar hazard zonation; an advantage at medium scale is to provide a map, based on minimum input layers indicating different levels of hazard potential. Thus, the map produced can be easily used for various planning purposes. Such fact is relevant in lahar-prone areas like Pampanga, Tarlac and Zambales, all being attack by lahar-related processes after the 1991 eruption. In developing countries like the Philippines, the advent of related processes after the 1991 eruption. In developing countries like the Philippines, the advent of remote sensing and GIS technology is of great help in delineating areas changed by repeated occurrences of natural hazards. Thus, this study makes use of remote sensed data to possibly detect changes and produce scientific based susceptibility map with reasonable accuracy.
For any GIS analysis, all maps entered for overlaying must have the same pixel value. In the study area, all rasterized maps as assigned 20m-pixel value as transformed from the georeferenced 1995 SPOT-XS.
Lahar Susceptibility Mapping
General
Susceptibility means the capability of being affected by natural damaging events or phenomena. Hazard is the probability of occurrence, within a specific time in a particular area, of natural damaging events (Varnes, 1984).
A hazard susceptibility map is a mpa derived from the analysis and interpretation of several sets of hazard-related data (Doornkamp in Peraz, 1992). He emphasized that the primary form of hazard map should show feature or set of features existing on the ground related to a particular hazard. With this, the extent of distribution of a particular process-hazard in a particular factor map is delimited. The output map shows the probable response of a particular map unit to specific hazards, expressed as a relative hazard within a simple homogenous map unit. The map to be produced is related to lahar processes actively in progress commonly during the onset of the rainy season. With the geomorphic parameters considered, the resulting susceptibility map can be used in preparing the lahar hazard zonation map. The outcome will in a way help and aid in planning any rehabilitation related purposes. The susceptibility map at the vicinities of Mt. Pinatubo is derived considering the set-up of the are, seven years after its eruption.
Methodology
The main method applied to generate the map is by deterministic approach and date-driven system. The deterministic approach is subjective with the "concept of possibility" (Kim, 1988) appears appropriate since a limited historical information related to the eruption is available. This is basically a direct mapping methodology wherein the susceptibility classes are determined on the discretion of the researcher. However, this direct mapping approach is only applicable in accessible areas. In here, of sequential satellite imageries and aerial photographs are extensively utilized particularly in inaccessible terrains. Decision rules used in this aspect are based on professional reasoning instead of pure statistical analysis.
For the data-driven technique, weights of parameter maps are calculated base from the density of the process map involved. The output map in this respect is purely statistically generated.
Generated Lahar Susceptibility Map
The susceptibility map created is delimited by the following condtions;
- That the susceptibility boundary is estimated based on direct mapping approach;
- That the map assumes engineering interventions;
- That the map is based on lahar lateral distribution;
- That this map applies to seven years after the eruption.
The susceptibility map generated from deterministic approach (Fig. 8.3 g) relies on the familiarity of the area and field observations conducted. The whole Sto. Tomas Plain is regarded as high to moderate where distance from the edge of the dike is one of the criteria considered. Although, distributary bars are generally elevated, those located 5.0 kms. Southward are highly susceptible to lahar deposition. Channels in the entire plain are also ranked as high since lahars directly deposited their loads along the conduits.
The reliability of the susceptibility maps generated is dependent on the [performance/stability of the armored dike constructed in the southern segment of Sto. Tomas River. The bit question is … HOW LONG CAN THE DIKE RESISTS THE DEMANDING FORCE OF INCOMING LAHARS?
Lahar Hazard Mitigation
Lahar produced from the eruption of Mt. Pinatubo is significantly hazardous to life and property at about 60 kms. Away from the volcano (PHIVOLCS, 1993). Human population and properties are always at stake from the devastating effect of lahars. Any structures along the route of lahars can be destroyed by direct impact or by inundation and burial from sediment accumulation.
Two basic strategies are suggested to mitigate the hazard;
- Prevent human population from occupying hazardous areas
- Prevent lahars from encroaching human settlements either by diverting and channeling the lahars along harmless flow paths.
The second strategy embarks on the construction of engineering works and structures. Most of the pre-eruption temporary dikes (artificial levees) on the downstream side had been breached in 1991 affecting Brgys. Alusiis and isolating Sta. Fe. When the bridge linking the village with San Rafael was toppled. In 1992, dikes were constructed, however overcome by succeeding lahars. Monitoring the constructed dikes is another aspect to ensure its effectiveness.
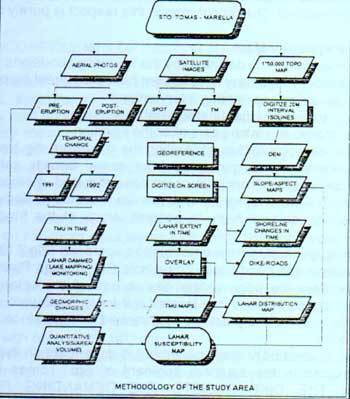
Fig. 1.4 Methodology of the study area
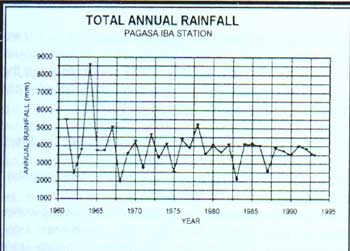
Fig. 2.2 Annual Rainfall Data in Zambales