| GISdevelopment.net ---> AARS ---> ACRS 1998 ---> Disasters/Pollutions |
Flood Damage Mapping in North
Korea Using Multi-Sensor Data
Choen Kim1 and
Kwang-Hoon Chi2
1Kookmin University, Dept. of Forest Resources
Seoul 136-702, Korea
Tel. : (82)-2-910-4813, Fax : (82)-2-910-4809
E-mail : choenkim@kmu.kookmin.ac.kr
2Korea Institute of Geology, Mining and Materials
P.O. Box, Yusung, Taejon 305-350, Korea
Tel. : (82)-42-868-3290, Fax : (82)-42-861-9720
Email: knchi@rock25t.kigam.re.kr
Abstract1Kookmin University, Dept. of Forest Resources
Seoul 136-702, Korea
Tel. : (82)-2-910-4813, Fax : (82)-2-910-4809
E-mail : choenkim@kmu.kookmin.ac.kr
2Korea Institute of Geology, Mining and Materials
P.O. Box, Yusung, Taejon 305-350, Korea
Tel. : (82)-42-868-3290, Fax : (82)-42-861-9720
Email: knchi@rock25t.kigam.re.kr
This paper shows that it is feasible to map the flood-suffered crop fields in the Chaeryong study area in Hawanghaepukdo province of North Korea by combining JERS-1-OPS and data.
The NDVI values derived from the JERS-1 OPS data were applied on the 3-second grid DEMs, whose coverage could easily identify the damage areas depending on elevation intervals.
Introduction
There have been several efforts to monitor the flood-suffered paddy fields in North Korea, whose western part got damaged by an unprecedented rainfall disaster from the middle of July to the beginning of August 1995 (Okamoto et at., 1998). It can be noted, however that much of the flood affected areas remain barren dry fields in lower elevation ranges of the mountains and the hills. The primary reason for this is that landslides and debris flow caused by downpour combined with deforestation destroyed the dry fields in lower elevation zones of the mountains. Regarding the chronic grain shortage of North Korea, the flood-suffered dry fields mapping is an important role in crop yield estimation, because corn is the second main crop of North Korea. Unfortunately, lack of information outside North Korea makes it difficult to collect archival land cover data on crop growing areas (Kim and Joung, 1998(.
In this study, digital elevation models (DEMs) and derivative topographic surfaces together with JERS-1 OPS/SAR data have been used to investigated the plausible explanation in an efficient corn monitoring.
The objectives of the study presented in this paper are to demonstrate that (1) flood damage pixels mapped through land-cover classification can be grouped depending on elevation intervals, using DEM data and (2) crop (e.g.) rice and corn) growing areas after the inundation of 1995 can be identified by using JERS-1 SAR data
Materials and Methods
Study Area
The test site is located in Hwanghaepukdo province which is one of the most intensively cultivated province in North Korea. The coordinates of the site, which covers 1,368km2, are defined as : (126o 00`E, 38o 29`N), (125o 59`E, 38o 15`N), (125o 24`E, 38o 30`N) Mostly the hills and the lower region of mountain forests in the site were transformed into agricultural lands in which landslide disaster occurred in the deluges of 1995. The site includes Chaeryong Plain located along the Chaeryong River, which is one of the most important rice production areas and also suffered severe damage from the flood of 1995.
Data Sources
JERS-1 OPS visible/near-infrared (VNIR) data acquired on 5 May 1997 were geometrically corrected for integration into the elevation data (a 3-second DEM). The high resolution DEM coverages were applied to differentiate the classified results, depending on elevation intervals.
The JERS-1 satellite provides also synthetic aperture radar (SAR) images at L band (23.0 cm wavelength) and a 35o angle of incidence with HH polarization. The SAR date level 2.0 format, which are 3 looked image products with ground resolution of 18.0 m range 18m azimuth (Musiake et al., 1993), were obtained on 28 May 1998.
The selected agricultural area SAR image used in the assessment of the mapped flood damage areas produced by JERS-1 OPS data was rectified by using image (SAR) - to image (OPS) rectification.
Methods
The JERS-1 OPS data were classified by using a supervised maximum likelihood algorithm, because the traditional classifier can perform well for detecting and mapping flood-suffered agricultural areas in case of large, bare ground, when the instantaneous field of view (IFOV) scale is less than the flood-suffered patch scale in the image (Jensen et al., 1995; Huguenin et al., 1997).
The classification results were edited into 8 classes ; namely flood damage, coniferous forest, water body, paddy field (seedbed), paddy field (fallow), dry field (general crops), deciduous broadleaved forest, and forest degradation Tables 1 and 2). All of the classes were checked by comparing the average normalized difference vegetation index (NDVI0 value with one another, because vegetation dynamics (e.g., biomass and condition) are highly correlated with NDVI (Malingreau, 1989 ; Singh, 1989 ; Tappan et al., 1992 ; Gamon et al., 1995 ; Michener and Houbhoulis, 1997 ; Lyon et al., 1998).
The NDVI values were very helpful to elucidate crop recovery conditions on flood impact agricultural areas in post-flood JERS-1 OPS imagery. Instead of image differencing for mapping land-cover dynamics after the flood passage, the JERS-1 SAR data as reference data were used to evaluate the flood-suffered crop fields identified in the classified map.
Due to all weather conditions of the microwave SAR data, neither image normalization between multi-data images, nor atmospheric correction, were performed.
Results and Discussion
After resampling both the JERS-1 OPS imagery and the grid-based DEM to the known 1:50,000 topographic maps, the acreage and NDVI of each land-cover class were typified by elevation intervals (Table 2).
Table 1 lists land-cover classes and their mean NDVI values of the study area Chaeryoung including the flood-suffered area.
| Classes | Cover area | NDVI | ||
| Hectares (ha) | Percent (%) | Mean | Std. Dev. | |
| Flood damage | 7470.85 | 5.46 | -0.0673 | 0.0401 |
| Coniferous forest | 4693.22 | 3.43 | 0.7642 | 0.1417 |
| Water body | 2928.13 | 2.14 | -0.6726 | 0.3740 |
| Paddy field (Seedbed) | 4009.07 | 2.93 | -0.2330 | 0.1306 |
| Padd field (Fallow) | 31388.50 | 22.94 | -0.1190 | 0.0464 |
| Dry field (corn etc.) | 26216.38 | 19.16 | -0.0790 | 0.0657 |
| Deci. broadlev. forest | 5500.51 | 4.02 | 0.2721 | 0.262 |
| Forest degradation | 54622.00 | 39.92 | 0.1452 | 0.1946 |
| Totals | 136828.63 | 100 | - | - |
Of the total 136,828 ha study area, 7,470 ha were mapped as flood damage and it covered 5.46 percent of the area.
Though about 60 percent of land area of North Korean is mountain forests, the mapping acreages presented table 1 were 2.93 percent of the study area as Seedbed, 22.94 percent as fallow appeared before transplanting, and 19.16 percent as dry field. As noted in the comparison between about 40 percent of including flood damage case and the merged total area of crop field classes including flood damage class (i.e., 40 percent versus 50.49 percent), approximately 10 percent of the observed increase difference may be explained by the transformation of the forested areas into agricultural areas (Kim and Joung, 1998).
In the case of temperate latitude during the dry season, paddy fields can be found by either bare condition or short cycle secondary crops. Accordingly, as the ground survey data are not available, the above classes should be evaluated by comparing their mean NDVIs. In evaluation NDVI in each of the four classes, the class with highest value was assigned as flood damage, and naturally, paddy field (seedbed) class exhibited the lowest NDVI value due to irrigation water (see, NDVI of water body).
Since most of pixels classified as flood damage were identified within the agricultural boundary based on the topographic map, the flood-suffered area was correspondent to 10.81 percent of the whole crop fields in the study area.
In addition, the 3-second DEMs overlaid on the classified map were used to differentiate the flood-suffered area depending on elevation intervals. Table 2 indicates that 97.83 percent of the flood damage area (covering 5.34 percent of the study area) remained below 100 m.
The main reason for this concentrated damage on the lower region below 100 m could be related to deforestation-induced flooding and sediment disaster.
To define discriminations among the above classes more clearly, the SAR image was used to interpret their surface roughness and soil moistures. Figure 1 shows the SAR image intensity of the respective five land-cover classes.
In order to determine significant separability of the five classes in the SAR image, the plotted mean values in Figure 1 should be compared with each other based on the t-hyphothesis test. The range of their t-test values varied from 6.25 to 365.79. On the basis, the five classes with JERS-1 SAR data could be significantly distinguished form each other
| Class | Elevation interval (m) | |||||
| 0-100 | 101-150 | 151-200 | 201-300 | 301-400 | 400< | |
| Flood damage | 5.340 | 0.094 | 0.020 | 0.0003 | 0.000 | 0.000 |
| Coniferous forest | 0.225 | 0.542 | 0.636 | 1.168 | 0.593 | 0.264 |
| Water body | 2.126 | 0.011 | 0.000 | 0.000 | 0.000 | 0.000 |
| Pf (seedbed) | 2.915 | 0.017 | 0.000 | 0.000 | 0.000 | 0.000 |
| Pf (fallow) | 22.783 | 0.132 | 0.021 | 0.005 | 0.000 | 0.000 |
| Dry field | 18.399 | 0.661 | 0.072 | 0.030 | 0.005 | 0.000 |
| Deci. bro.forest | 1.864 | 0.544 | 0.371 | 0.616 | 0.326 | 0.296 |
| Forest degradation | 28.463 | 6.377 | 2.454 | 1.897 | 0.482 | 0.248 |
| Totals | 82.115 | 8.378 | 3.574 | 3.719 | 1.406 | 0.808 |
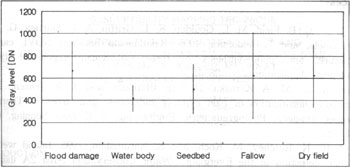
Figure 1. Mean grey level with +_ 1 standard deviation of the radar illumination backscattered by the different surfaces of the five classes : food damage of 224.297 pixels, water body of 89,305 pixels, paddy field (seedbed) of 122, 433 pixels, paddy field ( fallow) of 957,005 pixels, and dry field of 772,409 pixels.
Conclusions
The classified map extracted from JERS-1 OPS data was analyzed in conjunction with the 3-second grid digital elevation data. Classification results out of the study area indicate that none of the three forest-cover classes have show mean NDVI values between -0.2330 and -0.0673. Within the 4 types, the highest mean NDVI values is recorded in the flood-suffered paddy field, which covers 5.46 percent, i.e., 7,470 ha, of the area. This is an unexpected finding, for identification of flood-suffered area without using temporal data is very difficult. In addition, it is possible to identify the flood-suffered crop field in the classified map derived from JERS - OPS data, by using JERS-1 SAR data.
Acknowledgments
The National Space Development Agency (NASDA) of Japan provided the JERS-1 OPS/SAR data, whose ownership belong to MITI/NASDA.
References
- Gamon, J.A., C.B. Field, M.L. Goulden, K.L. Griffin, A.E. Hartley, G. Joel, J. Penuela, and R. Valentini, 1995. Relationship between NDVI, canopy structure, and photosynthesis in three Californian vegetation types. Ecological Applications, 5 : 28-41.
- Huguenin, R.L., M.A. Karaska, D. Van Blaricom and J.R. Jensen, 1997. Subpixel classification of bald cypress and tupelo gum trees in Thematic Mapper imagery. Photogrammetric Engineering & Remote Sensing, 63 : 717-725.
- Jensen, J.R., K. Rutchey, M. Koch, and S. Narumalani, 1995. Inland wetland change detection in the Everglades Water Conservation Area 2A using a time series of normalized remotely sensed data. Photogrammertic Engineering & Remote Sensing, 61 : 199-209.
- Kim, C., and K.H. Joung, 1998. Application of vegetation indices for forest degradation using Landsat Tm data. Proc. of International Symposium on Remote Sensing, Kwangju, Korea, pp. 192-197.
- Lyon, J.G.D. Yuan, R.S. Lunetta, and C.D. Elvidge, 1998. A change detection experiment using vegetation indices. Photogrammetric Engineering & Remote Sensing, 64: 143-150.
- Malingreau, J.P., 1989. The vegetation index and the study of vegetation. A;;lications of Remote Sensing to Agrometeorology, Kluwer Academic Publishers, Dordrecht, Netherlands, pp. 285-303.
- Michener, W.K., and P.F. Houhoulis, 1997. Detection of vegetation changes Michener, W.K., and P.F. Houhoulis, 1997 Detection of vegetation changes associated with extensive flooding inn a forested ecosystem. Photogrammetric Engineering & Remote Sensing, 63 : 1363-1374.
- Musiake, K., T. Oki, M. Koike, T. Nakaegawa, and G.Fuchgami, 1993. Ectraction of soil moisture information using JERS-1 SAR image. JERS-1 Information Exchange Meeting Presentation Materials, Tokyo, Japan, pp. 309-326.
- Okamoto, A.,S. Yamakawa, and H.Kawashima, 1998. Estimation of flood damage to rice production in North Korea in 1995. International Journal of Remote Sensing, 19(2) : 365-371.
- Singh, A., 1989. Digital change detection techniques using remotely-sensed data. International Journal of Remote Sensing, 10: 989-1003.
- Tappen, G.D.,D. Tyler, M. Wehde, and D. Moore, 1992. Monitoring rangeland dynamics in Senegal with Advanced Very High Resolution Radiometer data. Geocarto International, 1 : 87-98.