| GISdevelopment.net ---> AARS ---> ACRS 1998 ---> Digital Image Processing |
Primary Study of Fourier
Spectrum Feature Extraction for HyperSpectral Image
Pai-Hui Hsu , Yi-Hsing
Tseng
Deparatment of Surveying Engineering, National Cheng-Kung University
No. 1 University Road, Tainan, Taiwan, R.O.C.
Tel: +886-6-2370876 Fax: + 886-6-2375764
E-mail : p6885101@sparcl.cc.ncku.edu.tw
Key words: hyperspectral data, spectral
analysis, feature extraction, class separability
Deparatment of Surveying Engineering, National Cheng-Kung University
No. 1 University Road, Tainan, Taiwan, R.O.C.
Tel: +886-6-2370876 Fax: + 886-6-2375764
E-mail : p6885101@sparcl.cc.ncku.edu.tw
Abstract
Recently due to the advance of image scanning technology, hyperspectral image scanners which have tens or even hundreds spectral bands have been invented. Comparing to the traditional multispectral images, hyperspectral images include richer and finer spectral information than the images we can obtain before. Theoretically, using hyperspectral images should increase our abilities in classifying land use/cover types. However, when traditional classification technologies are applied to process hyperspectral images, people are usually disappointed at the consequences of low efficiency, needing a large amount of training data, and hard improvement of classification accuracy. In order to solve this problem, technologies of hypersepctrial data analyses and processes must be developed. First, this paper illustrates the characteristics of three different spaces (Images, Spectral and Feature) in which hypersectral data can be inspected. Then, some fundamental statistical theories and graphical presentations of the statistics for hyperspectral images are introduced and spectral differences are analyzes in difference spaces. Two methods of data transformation for feature extraction are discussed in this paper. In addition to spectral to spectral differences, differences between two hyperspectral data classes are also analyzed.
Introduction
In the past two decades, multispectral sensors have been widely used to investigate various phenomena on the earth surface. Image data obtained by such sensors traditionally have the number of spectral bands less than 20. Recently, due to the advance of imagery technology, the new generation of remote sensors, referred as imaging spectrometers or hyperpectral images with hundreds of contiguous narrow spectral bands, These images are commonly referred as hyperspectral images.
As featured in high spectral resolution, fine spatial resolution, and a large dynamic range, hyperspectral images have led to the hope in increasing our abilities of exploring, investigating, and identifying subtle phenomena displayed on the earth surface. However, by extending the data analysis approaches, which have been successfully applied to multispectral images, to Hyperspectral data analysis, one would commonly be disappointed at not obtaining better results and the low efficiency of data processing. In order to explore the power of hyperspectral images, this problem has to be investigated and analyzed.
This paper will first study the spectral difference between two image pixels. By using the distance between two points in the feature space formed by spectral bands as the quantification of the spectral difference, the variation of the spectral differences subject to the changes of dimensionality is investigated. Similarly the characteristics of the spectral difference between two classes of pixels, referred as class separability, are also analyzed. Based on this study, one can easily discover that the class separability among a set of spectral data will become more and more indistinguishable when the number of the dimension of the feature space is increasing. The phenomenon explains the problem mentioned above and leads us to develop a favorable method that can reduce the dimensionality and maintain the class separbility for hyperspectral data by extracting features from the original data.
Coinciding with our discovery, many articles indicate that the traditional classification techniques can be retrained if hyperspectral data are preprocessed properly in advance. However, a linear transformation performed in the feature space, such as Principal component Transformation (PCT), is usually applied to extracted features. Although this method can effectively provide good classification accuracy when number of dimension is reduced, it is sensitive to noise and has to be performed with the whole data set. As opposed to a liner transformation, this paper proposes a nonlinear transformation that is Fourier Spectrum Transformation (EST) of the spectral data for each pixel. Therefore, it is named Fourier Spectrum Feature Extraction (FSFE), in this paper. This transformation is featured in the use of the frequency characteristics of the spectral data. The new feature space formed by the Fourier spectrum is expected to more meaningful and more stable than that formed by PCT. Finally, a 220-band AVIRIS data are analyzed to illustrated our discovery and tested to show the efficiency of SEF.
The representation of hyperspectral data
For the convenience of analyzing and quantifying the characteristics of hyperspectral data, it is necessary to define mathematically and conceptually some representation space inspect the data variations from some aspects. Landgrebe (1997) illustrated that there have been three principle ways in which multispectral data are represented quantitatively and visualized. See Figure 1. The same representations are still convenient for hyperspectral data.
Data in the images space directly offer a visual way to understand the spatial variation of the scene and the relationship between an individual pixel and the land cover class it belongs to Tasks of manual image interpretation are usually carried out in the image space. Spectral space shows the spectral variation of pixels respectively. Each curve shown in the spectral space can be thought as a response function of wavelength. Theoretically each class related to the Composition of different material has its own shape and variance of the spectral curve. Some methods like "spectral matching" or "spectral angle mapper" use this property to distinguish the unknown spectral curve comparing with a series of pre-labeled spectral curve. In feature space, a pixel with n-band measurement is viewed as a point, i.e., a vector in an n-dimensional space, and the sets of the n-band measurements within a class is considered as a pattern. The characteristics of classes are modeled base on the stochastic or random process approach. During the past three decades, "pattern recognition" based on the statistic approach has been used successfully in the classification of multispectral data (Swain and Davis, 1978). However, the existing statistic approach to classifying hyperspectral data often brings the consequence of failures to achieve satisfactory results. This reveals that extracting substantial information from hyperspectral data is critical in the study of hyperspectral data. The feature space provides the mathematical basis for information extraction.
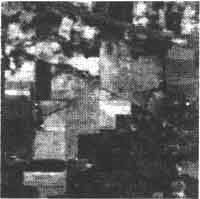 Image Space |
 Spectral Space |
 Feature Space |
| Figure 1. Three forms for representing multispectral data | ||
The analysis of spectral difference in spectral space
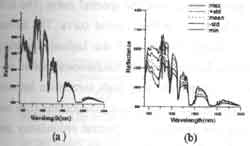
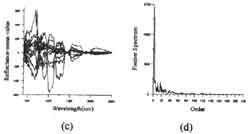
The spectral response of a material can be defined as a spectral signature (Schowengerdt, 1997) by the reflectance or radiance as a function of wavelength. Theoretically, different types of materials can be distinguished on the basis of differences in their spectral signature. However, the difference is often not distinguishable due to some factors, including the variation of the sensor, the atmospheric scattering the nature variability for a given material type, etc. Objects of a certain class may not reflect incident light identically. Figure 2(a) shows the spectral variation of alfalfa. Some fundamental statistics can be used to describe the characteristics of the spectral variation. In Figure 2(b), the mean curve represents the trend of the spectral variation. The standard deviations show the scattering to the mean. And the maximum and the minimum values present the range of variation One can discover that two different object classes may have very similar mean, but present very different standard deviation, maximum and minimum values. Therefore, it is important to inspect every aspect of spectral variation. In order to view the spectral variation in the frequency domain, we transform spectral curve to the space of the Fourier power spectrum as show in figure 2(d).
In order to quantify the difference of two spectral curves, the Euclidean distance and spectral angle between two different vectors in feature space are calculated. In figure 3(a), we can see that the distance between two pixels of wheat and oats increase as the number of Spectral bands increase. This phenomenon will be discussed in feature space later. Figure 3(b) show the Euclidean between two alfalfa samples.
 |
 |
| Figure 2. The variability of a spectral curve. | |
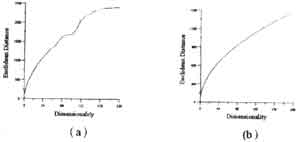 Figure 3. The Euclidean distance between the wheat and oats classes | |
Features of Fourier spectrum
As described above, hyperspectral data potentially contain more information than multispectral data because the higher spectral resolution, but the traditional classification techniques can not provide better result when the number of spectral bands increases. The key problem is that the accuracy of parameters estimation of stochastic models depends substantially on the ratio of the number of training samples to the dimensionality of the feature space (P-Fuei Hsien, 1998). There are two possible ways to resolve the problem, one is to increase the number of training samples needed to characterize the classes increase as well, and another is to find the lowest dimensional subspace to use for classification purposes. The former time-wasting and unpractical, the later which is called "feature extraction" is generally though as the way to use hyperspectral data efficiently.
Many articles indicate that the traditional classification techniques can be retrained for hyperspectral data if features for classification are extracted properly. These may be all or a subset of the original hyperspectal data, or derived features, such as the Principal component Transformation (PCT) and Fourier Spectrum Transformation (FST) used in this paper. PCT is a linear transformation performed in the feature space. Although this method can effectively provide good classification accuracy when the number of dimension is reduced, it is sensitive to noise and has to be performed with the whole data set. Usually the first PCT component contains the maximum possible variance for any linear combination of the original bands. However, significant band differences may also appear only in the higher-order components.
As opposed to a linear transformation, EST is a nonlinear transformation which is featured in the use of the frequency characteristics of the spectral data for each pixel. The frequency power spectrum can localize information about global patterns of the spectral curve. The first power spectrum can localize information about global patterns of the spectral curve. The first component which has zero frequency represents the mean of the spectral curve. The lowest nonzero frequency component is known as the "fundamental", and the highest frequency component called the third harmonic is three times the frequency of the fundamental, and so on.
In high dimensional hyperspectral data, there is frequently very high correlation between adjacent bands, and most information are distributed along a few major components (Lee and Langrebe, 1993). The both two transformation can remove the spectral redundancy and concentrate the most information in the low dimension of feature of feature space.
The analysis of class separability
A separability analysis can be performed on the training data to estimate the expected error in the classification for various features combinations (Swain and Davis, 1978). The results may suggest that some of the initial features can be dropped before classification of the full data. In this paper the Euclidean, Bhattachayya and Jeffries-Matusita distance are calculated for the raw data, and the data after DCT and FST processing. See Figure 5, 6 and 7. As the dimensionality increase, the separability increases and do not asymptotically converge to one. It seems that increasing the number of spectral bands (dimensionality) potentially provides more information about class separability. In practically this is not logical in classification . In fact the classification accuracy first grows and then declines which is often referred to as the Hughes phenomenon (Hughes, 1968)
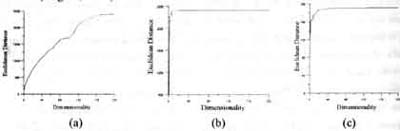
Figure 5. The Euclidean distance for (a) raw data (b) PCT data and (c) FST data
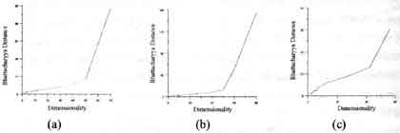
Figure 6. The Bhattacharyya distance for (a) raw data (b) PCT data and (c) FST data
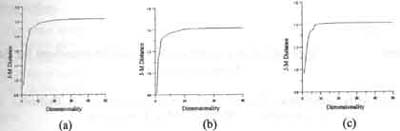
Figure 7. The Jeffries-Matusita distance for (a) raw data (b) PCT data and 9c) FST data
In this paper we find that looking for an appropriate definition for interclass seprability is not trivial. The result in figure 5, 6 and 7 shows that the Jeffries-Matusita Distance seems to the proper one among the three separabilities because it always converges on low dimensionality. However, we are still trying to take more separabilities to estimate the accuracy for classification.
Conclusion
This paper first illustrates the characteristics of three different spaces in which hyperspectral data can be represented. Then we analyze the characteristics of different spectral signatures in spectral space. We find that some fundamental statistics can be used to distinguish different type of materials. Similarly the characteristics of the spectral difference between two classes of pixels, referred as class separability, are also analyzed. The Feature Extraction method such as the Principle Component Transformation and the Fourier Spectrum Transformation can reduce the correlation between adjacent bands in high dimensional hyperspectral data. Before extraction features, a separability analysis can be performed to estimate the expected error in the classification for various combinations. The results can be used in classification.
Reference
- Houghes, G.F. (1969), On the Mean Accuracy of Statistical Pattern Recongnizes, IEEE Trans. Inform. Theory it -14, pp. 55-63.
- Landgrebe, D.A. (1997) on Information Extraction Principles for Hyperspectral Data (A White Paper), obtained from http://dynamo.ecn.purdue.edu/~biehl/MultiSpec/documentation.html
- Lee, C. and D.A. Landgrebe (1993), Analyzing High Dimensional Multispectral Data, IEEE Transactions on G&RS, 31(4):792-800.
- Pi-Fuei Hsien (1998), Classification of High Dimensional Data. Ph.D. dissertation, School of Electrical and Computer Engineering, Purdue University, West Lafayette, Indiana.
- Swain P.H. and S.M. Davis, eds. (1978), Remote Sensing: The Quantitative Approach, McGraw Hill, New York.
- Schowengerdt, R.A. (1997), Remote Sensing Models and Methods for Image Processing (Second Edition), Academic Press.