| GISdevelopment.net ---> AARS ---> ACRS 1998 ---> Digital Image Processing |
A Fusion Approach of
Multi-sensor Remote Sensing Data Based on Wavelet Transform
He Guojin Li Kelu Hu
Deyong
China Remote Sensing Satellite Ground Station, Beijing 100086
E-mail: gjhe@nts.rsgs.ac.cn
AbstractChina Remote Sensing Satellite Ground Station, Beijing 100086
E-mail: gjhe@nts.rsgs.ac.cn
The fusion of multisensor and multire solution satellite data is an effective means of exploiting the complimentary nature of different daya types. This paper presents a data fusion approach based on wavelet transform. With this kind of merger, higher spatial resolution SPOT-PAN data is fused with lower resolution multispectral TM. First of all, the paper makes a discussion on the effort of different length of Daubechies Wavelet Basis to the fused images, and then the wavelet approach as been compared to HIS and PCA image fusion technique and has been shown to possess the advantage of minimal distortion of the spectral characteristic of the data visible enhancement of spatial quality. It has exhibited the potential application of wavelet transform for higher accuracy for fusing spectral -spectral information of multisource sebsed data.
Introduction
A number of earth observation available satellite programs have provided us with huge remote sensing data in multi-sensor, multi-resolution, multi-spectral and multi-temporal. These data have built up a pyramied of image data for the investigation of global change, environment and limitations of these kinds of remote sensing data when they are applied to different research or practical purposes. That means, thus far, it has not been possible to propose a single sensor package that will meet all our application requirement, while the combined image from multiple sensors will provide more comprehensive information by collecting a wide diversity of sensed wavelengths, spatial resolutions, and look-angles. For that, greater emphasis today is being placing on the data fusion technique, an effective means of exploiting the complimentary nature of various imagery types, to generate an interpretation of the scene not obtainable with data from a single sensor, or to reduce the uncertainty associated with the data from individual sensor.
Many works have recongnized the benefit of merging multisensor and multiresolution satellite data, and numerous merging approaches, such as the HIS transform (Hayden it al. 1982), PCA analysis (Chavez, et al. 1991) and HPF method (Jim, 1996), were presented in previous literature. Recently, the wavelet transform has been used for merging data derived From different resolution sensors (Li et al. 1995, Yocky, 1996). However work has seldom been done to explore the effects of different wavelet coefficients to the fused image in both spectral and spatial features.
Aimed at geological application, this paper tries to merge the high-resolution SPOT PAN with the color TM images using wavelet transform. On the one hand, the authors perform a discuss on the relationship between wavelet coefficients and the fused results, and set up the fusion model called "FWT"; On the other hand, the paper also present a comparison of the fused images which were merged by wavelet transform, PCA and HIS methods respectively.
Review of the Wavelet Transform
If there exists a function y(t), which is well localized and also meets the condition of:
 we call that function
group {ya,b} generated by y(t) is Analyzing Wavelet (Mallat 1989, mayer 1992):
we call that function
group {ya,b} generated by y(t) is Analyzing Wavelet (Mallat 1989, mayer 1992):
Parameters: a is a scale factor and b is a translation factor
It has been proved that such a set of function y(t)can generate a following orthogonal base of square bounded function L2(R) by changing the a b parameters:
y (2-k t-n) k,n denote the set of integers
Thus, each signal f(t) can be decomposed in the basis as followed, and the corresponding coefficients are defined as wavelet coefficients:
As for remote sensing data, we used a filtering approach of wavelet decomposition followed by subsampling (Mallat 1989). This is decomposed into a low pass approximation and three high pass detail images (wavelet coefficients) which correspond to the three direction : horizontal, vertical, and diagonal.
In that way four under images (HH, GH, HG, and GG) can be obtained from one full resolution image (Bruno Garguet-Duport et al. 1996). HH is the context image at the inferior resolution (the approximation), GH is the image of the horizontal details, HG is the image of the vertical details, and GG is the image of the horizontal details, HG is the image of the vertical details and GG is the image of the diagonal details(see Figure 1).
Perfect reconstruction of the original can also be achieved through the inverse wavelet transform (Daubechies, 1988).
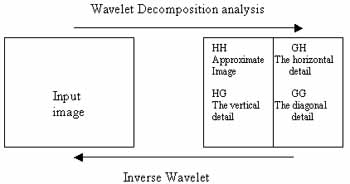
Figure 1 One Level Diagram of Wavelet Transform
Methodology
The TM and SPOT-PAN data in this paper were acquired on 27 March 1997 by Landsat Thematic Mapper and on 25 August 1996 by SPOT (Satellite Pour I' Observation de la Terre) respectively.
(1) The "FWT" Wavelet Fusion Model
The procedure of "FWT" model can be described as followed:
Step(1): To produce three new SPOT PAN images whose histograms are specified according to the histogram of each TM3, TM4, TM7, namely SPOT-PAN/TM3, SPOT-PAN/TM4, SPOT-PAN/TM7.
Step(2) : choose the wavelet basis for the transform, and perform the wavelet decomposition analysis to generate (from SPOT-PAN/TM3, SPOT-PAN/TM4, SPOT-PAN/TM7) detail information (vertical, horizontal and diagonal) and the approximation images of 20-m spatial resolutions (presented as SPOT-PAN/TM3', SPOT-PAN/TM4', SPOT-PAN/TM7').
Step (3): The original TM3, TM4, TM7 are spatially registered to the approximation images of 20-m spatial resolutions.
Step (4): Replace the approximation images (SPOT-PAN/TM3', SPOT-PAN/TM4', SPOT-PAN/TM7') with the registered original TM3, TM4, TM7 respectively.
Step (5): Introduce the detail information into the registered original TM3, TM4, TM7 through the inverse wavelet transform, and generate the fused 10-m fTM3, fTM4, fTM7 images respectively.
Upper procedure is only for one level wavelet decomposition. In other application purpose, you may choose the different final resolution and perform more than one time wavelet transform.
(2) About the choice of the wavelet basis.
In this study, we have found that the choice of the wavelet basis does affect the fused images. Having implemented the image fusion using the wavelet basis (Daubechies, 1988) from the length of 4 to 20, we compare these fused images and obtain the best result derived from wavelet transform in the wavelet basis of 10. Figure 2a is the result of color combination of fTM3, fTM4, fTM7 in R,G,B channel.
(3) Quality Assessment of the Resulting Images
In order to evaluate the improvement of the fused images, in both spectral and spatial features, the result images are compared with the original TM bands (TM3', TM4', TM7- Figure 2D) which were geometrically corrected to 10 SPOT-PAN, and also compared to the synthetic images merged by HIS transform (Figure 2B) and PCA approach (Figure 2C). The comparison is performed by statistical method and by visual interpretation.
(i) A comparison Based on Statistical Method
The factors computed to qualify the fused results are as followed: mean, standard deviation, entropy, percentage presentation of no value changed pixel for each band and the best combination index for fused color image respectively. The statistical results are shown in TABLE 1.
| Fusion Approach | Band | Mean | Entropy | Standard Deviation | Not changed pixel(%) | Best index factor |
| FWT | fTM3 | 74.80 | 5.74 | 9.12 | 13.38 | 13.9 |
| FTM4 | 63.13 | 5.45 | 8.30 | 14.74 | ||
| fTM7 | 80.20 | 5.92 | 8.60 | 12.13 | ||
| IHS | TM31 | 75.15 | 5.37 | 9.18 | 10.82 | 10.8 |
| TM41 | 63.51 | 5.22 | 8.37 | 12.35 | ||
| TM71 | 80.74 | 5.33 | 8.63 | 10.60 | ||
| PCA | TM31 | 74.14 | 5.26 | 9.55 | 9.65 | 10.8 |
| TM41 | 63.22 | 5.27 | 9.61 | 6.90 | ||
| TM71 | 80.23 | 5.16 | 8.86 | 7.40 | ||
| Corrected original image | TM3 | 74.37 | 4.61 | 5.84 | ……. | 8.1 |
| TM4 | 62.87 | 4.61 | 5.82 | ……. | ||
| TM7 | 79.86 | 5.02 | 7.96 | ……. |
Note: the formulas used to compute entropy is as

The entropy presents information measurement involved in single band, while the best index factor shows the information presentation of complex color image. The larger the entropy or the best index factor is, the more information quantity the image has. From the TABLE 1, it is obvious that the entropy and the best index factor of the fused images, not only by FWT approach but the entropy and the best index factor of the fused images, not only by FWT approach but also by HIS and PCA methods, have improved a lot when compared to original images. It has directed the explanation that the information of the fused images has accumulated, and FWT model does the best job.
The analysis from the factors of standard deviation and percentage of no value changed pixel for each band result in the fact that the FWT approach possesses the advantage of minimal distortion of the spectral characteristic of the data. This is because that the wavelet algorithm acts as a double function filter: high-pass and low-pass filter, and the spectral Changes of the fused images only cause by high frequency information -the detail image.
(ii) Visual Analysis
Figure 2A, 2B, 2C and 2D are the color composite images of which derived from GWT, HIS, PCA fusion approaches and from geometrically corrected original bands respectively. Obviously, the spatial measurements of fused images (2A, 2B and 2C) have been greatly enhanced as compared to the original image 2D. They almost have the spatial quality as that of SPOT-PAN. As for geological interpretation purpose, the fused images appear to be more accurate presentation of geological units, not only lihological character but also structural details. However, the colorful appearances of the resulting images are somewhat different from the original one, and 2A maintains color exhibition much similar to that of the original image.
Conclusion
For satellite remote sensing application, the fusion of multisensor satellite data is an effective means of exploiting the complimentary nature of different data types. This paper presents the utility of wavelet transform for data fusion purpose illustrated by an example of Landsat-TM and SPOT-PAN images. We have made a discussion on the effort of different length of Daubechies Wavelt Basis to the fused images and have found that the quality of fused image results in choice of the wavelet basis. In this case, the Daubechies wavelet basis has been proved to possess the advantage of minimal distortion of the spectral characteristic of the data as compared to HIS and PCA image fusion technique and has been shown to obviously improve the spatial quality contrasted with original TM data. It has exhibited the potential application of wavelet transform for higher accuracy for fusing spectral-spatial information of multisource remotely sensed data. However, any of the three fusion approaches can perform perfect reconstruction.
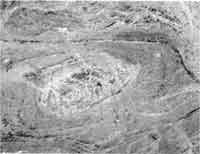 Figure 2A Fused image by FWT |
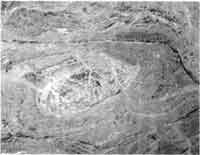 Figure 2B Fused image by IHS |
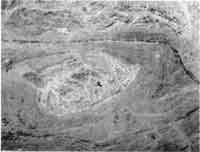 Figure 2C Fused image by PCA |
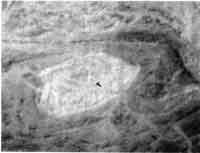 Figure 2D Original TM image |