| GISdevelopment.net ---> AARS ---> ACRS 1998 ---> Digital Image Processing |
Quality Analysis of
Synthesized High Resolution multispectral Imagery
Yang-cheng Liao,Tengh-yih
Wang and Wei-teng Zheng
Department of Surveying Engineering National Cheng Kung university
University Road 1,Tainan Taiwan
Tel (886)-6-2370876 Fax: (886)-6-237564
E-mail : ycliao@mail.ncku.edu.tw
Key words: image registration, image fusion,
linear feature, quality analsis Department of Surveying Engineering National Cheng Kung university
University Road 1,Tainan Taiwan
Tel (886)-6-2370876 Fax: (886)-6-237564
E-mail : ycliao@mail.ncku.edu.tw
Abstract
In Taiwan there exist significant natural environment changes. To aid environment management, planning and monitoring, the environment changes detection on the land must be done firstly. For that, the SPOT and LANDSAT imagery could be available, but their spatial and temporal resolution is not yet fine enough for practical application in Taiwan. It might be applicable to integrate high resolution panchromatic images and low resolution multispectral imagery into a synthesized high resolution multispectral imagery. The quality of synthesized imagery might be different from one of real high resolution . In this paper, the indices of correlation coefficients, signal-noise-ratio, momentum of differences pixel value and entropy value are used to evaluate the difference of both kinds of imagery
1. Introduction
The multispectral images provide necessary information for land cover interpretation, but don't have sufficient spatial resolution. Therefore, there are different methods to integrate high resolution BW (=black-white) image and low resolution multispectral images into synthesized high resolution images.(Yun Zhang 1997) analyzed the HIS method (=intensity, Hue, saturation), the PCS method (=principal component substitution), the RVS method (=Regression Variable Substitution ) and the SVR method (=Synthetic Variable Ratio), and verified that HIS and PCS yield finer spatial resolution, SVR provided good spectral information and RVS gives worst spatial and spectral data. (Shue and Tseng 1998) tries to utilize the hyperspectral imagery and the image registration and fusion techniques ti improve the data quality of SPOT images for land cover interpretation (Shieh 1994) studied four integration methods for SPOT multispectral and panchromatic imagery, namely colour space transformation, principal component analysis, high pass filter methods and radiometric method. In these method, only spectral data quality of the synthesized imagery are analyzed. To exam not only spectral but also spatial data quality of the synthesized imagery, this paper uses also the techniques of linear feature extraction,e.g. Foerstner Operator and canny operator (Chio and Wang 1996) investigated the accuracy of the Foerstner Operator on feature extraction. Canny Operator can be used to extract linear features (canny 1986). One can utilize the synthesized imagery
2. Image Synthesis
There are in general two steps to integrate high resolution panchromatic and low resolution multispectral imagery :image registration and image fusion
2.1 Image Registration
Image registration aims to overlay two images and unify their resolution and coordinate system. It contains generally there processes:
- Selection and matching of GCP (=ground control points):In practice, GCP are often high contract feature, e.g.house corner points area are used to get an accurate registration. One can use area-based matching techniques or feature based matching techniques ( Lemmens 1988) to homologous GCP points in stereo image pairs .(Tang 1995) approved that a better matching accuracy can be reached if both matching techniques are combined together.
- Coordinate Transform :The high resolution panchromatic image is often used as a reference one to unify the image coordinate system. The GCP points on low resolution multispectral images are then transformed into the reference image system. The simple affine transformation is available e.g.for satellite (Jensen 1986). The other polynomial transformation of higher order might be also suitable, if the land surface is relatively flat and the angle of FOV (=field of view) is not large (Schowengerdt 1007).
- Resampling: image value on a new transformed position in multispectral image can be determined by different interpolation methods, e.g.cubic convolution, bilinear interpolation and nearst neighbor method (pen and pan 1991).
2.2 Image fusion
Image fusion integrates both spatial and spectral data to hold superior characteristics of high spatial and spectral resolution and no improve our knowledge of a scene. The fused image should improve the image classification accuracy ( Munechika 1993) and helps feature extraction and recognition (vrable 1996). The image fusion methods can be divided into two classes: spatial domain method and spectral domain method.(Chavez 1986) proposed to extract firstly the high frequency component from the high spatial resolution image and add it to the low resolution image. This is one of the spatial domain methods. The spectral domain methods to be used in most application are color space transformation and principal component analysis. Therein the color space used in most image processing are the RGB (=Red-Green-Blue) color space, YIQ (=Y-signal, Inphase, Quadrature phase) color space, and HIS(=Intensity-Hue-Saturation) color space. In this paper, the HSV(=Hue-Saturation-value) model is used as a color space and the image fusion done as follows:
- The RGB color space is transformed to the HSV model:
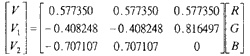
- The gray value g' of a pixel in the black-white image is used as the Value in the related color image, i.e. in the above equation V=g'.
- The HSV model is transformed inversely to the RGB space.
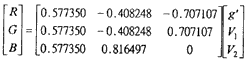
It is feasible the value in the HSV model for a image is replaced in our experiments by the gray value g' of the corresponding black-white image, because the RGB bands overlap with the panchromatic band. If the multispectral imagery covers the infrared band, the above -mentioned method for image fusion is not usable any more, because the intensity of infrared is not correlated with the one of visible light. To solve the problem, the fusion method proposed by carper is utilized in this paper to merge panchromatic and multispectral images of SPOT data. Table 1 shows the SPOT spectral bands. In the color space transformation , the vector (R,G,B,) is replaced by the vector (XS3,XS2,XS1).since the panchromatic band don't cover the infrared one, the improved fromula
 is used as the intensity in the IHS
model, namely the value in the above-mentioned HSV model.
is used as the intensity in the IHS
model, namely the value in the above-mentioned HSV model. 4. Quality Analysis
A. Four Methods for Spectral Data Quality Analysis
Four methods are used here to study spectral differences between synthesized and real high-resolution images. They are correlation coefficient analysis, momentum analysis, entropy analysis and signal -to- noise analysis
3.1 Correlation coefficient
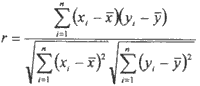
Where x1,y1 are the gray value of homologous pixel synthesized image and rreal high-resolution image, and
 are the mean gray values of both images.
A larger absolute value r means a higher correlation and vice versa.
are the mean gray values of both images.
A larger absolute value r means a higher correlation and vice versa.
3.2 Moment
This method computer the differences of gray value of homologous pixel, and their mean value (1st order momentum) and standard deviation (2nd order momentum) as well to estimate spectral variation of synthesized and real images.
3.3 Entropy
The following first-order entropy is used as an index to measure the amount of image information:
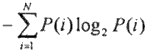
where p(i) is the probability of the i-th gray value level
3.4 Signal-to Noise Ratio
Hereby, only white noise is considered and it is supposed to be an independent variable of a Gaussian distribution with the mean of zero. Thereupon, image variance equals the summation of signal variance and noises one. The standard deviation of gray value in a homogeneous image area is regarded as the estimation of noise variance. Then, image variance minus noise one is equal to signal variance. Signal variance divided by noise one yield the SNR value.
Additionally, image feature extraction is done for both kinds of images. The number and quality of extracted features are used to measure their spatial data quality.
B. Linear Feature Extraction for Geometric Data Quality Analysis
The Foerstner operator (Foerstnear 1994) is used in this paper to extract linear features. The entire image area is firstly classified into homogeneous segment, point regions and line regions by a homogeneity index from the local average squared gradient. Secondly , accurate positions of lines are determined. After deleting those short line segments, one draws a histogram of the lengths of line segments. It is used to exam the difference of spatial resolution of synthesized and real-resolution images.
4. Experimental Results
As present, the finest resolution of SPOT imagery is 10m. In order to simulate images with finer resolution, the AMSS (=Airborne MultiSpectral Scanner) data are utilize in our experiments. The test images are taken c.a.at 11.00 a.m. on 1989 in Tainan, Taiwan. The flight height is about 2500 feet above ground and resolution is about 2m. Table 2 indicates the AMSS spectral bands.
The XS1,XS2,XS3,PAN-band resolution of SPOT imagery refer to AMSS composite images by 4+5 channels, 6+7 channels, 9 channel, and 4+5+6+7 channels, respectively. Thereby, we got a similated panchromatic (black and white) image with 2m resolution, denoted by image A, and a false color image with 2m resolution, named image B. The image B is low-pass filtered to yield a multispectral color image with 10m resolution, named the image C. The images A and C are merged by the above-mentioned image registration and fusion procedures to yield a multispectral image with 2m resolution, named image D. We use then image Band D to do the quality analysis. Both false color image B and D seem visually to be the same with each other. Nevertheless, their infrared image show great difference. Table 3,4 and 5 show the correlation coefficients between images A and B, A and D, B and D, respectively. PAN is the single band data of image A. (XS3,XS2,XS1) and (M_XS3, M_XS2, M_XS1) are the there bands of image B and D, respectively. Table 3 shows that XS1 is highly correlated with XS2 and the channel PAN is also highly correlated with XS1and XS2, where the correlation coefficients are larger then 0.9. On the contrary,XS3 has very low correlation with XS1,XS2 and PAN. It hints that land covers, especially vegetation distributed in the most test image area, response in the XS3 channel differently to the other 3 bands, where the XS3 cover the infrared band. Similarly, Table 4 shows that M_XS1, M_XS2 and PAN are highly correlated with each other. Table 5 indicates that synthesized image D is highly correlated with its high-resolution multispectral image B. The spectral characteristics is well-retained in the image merging. The entropy values of images A,B and D are shown in Table in 6. The image D larger entropy values then B. It means that the fused image contains more image texture. Table 7 shows the variances of signal and noise value. A small image window of the size 5*5 pixels is regarded as a homogeneous image area, if the difference of their gray value is 5 ( gray value unit ) in maximum. The noise is evidently much less then the signal. It means that the test images have significant image contrast and influence of the noise on our tests is very insignificant. Table 8 shows the length and number of linear features. Visual check indicated that the image D has much more complicated linear features then the images A and B. The length unit used pixel. All lines with length less then 6 pixels are regarded as short line segments and are deleted. The total length and total number of image D is larger then B. It means synthesized image contains more feature.
5. Conclusion
In our experiments, the synthesized image is simulated merging the high-resolution panchromatic imagery and the low-resolution multispectral one the HSV model. The result show the synthesized image is spectrally fast the same as its original multispectral image. Nevertheless, it contains more spatial information. This characteristic is very helpful for image recognition and classification.
| BAND | Wavelength(mm) |
| XS1 | 0.5-0.59 |
| XS2 | 0.61-0.68 |
| XS3 | 0.79-0.89 |
| PAN] | 0.51-0.73 |
| CHANNEL | Wave length (mm) |
| 1 | 0.38-0.42 |
| 2 | 0.42-0.45 |
| 3 | 0.45-0.50 |
| 4 | 0.50-0.55 |
| 5 | 0.55-0.60 |
| 6 | 0.60-0.65 |
| 7 | 0.65-0.69 |
| 8 | 0.70-0.79 |
| 9 | 0.80-0.89 |
| XS1 | XS2 | XS3 | PAN | |
| XS1 | 1 | |||
| XS2 | 0.9788 | 1 | ||
| XS3 | -0.0754 | -0.1194 | 1 | |
| PAN | 0.9935 | 0.9956 | -0.1001 | 1 |
| M_XS1 | M_XS2 | M_XS3 | PAN | |
| M_XS1 | 1 | |||
| M_XS2 | 0.9860 | 1 | ||
| M_XS3 | -0.0700 | -0.1148 | 1 | |
| PAN | 0.9914 | 0.9863 | -0.0388 | 1 |
| XS1 | XS2 | XS3 | PAN | |
| M_XS1 | 0.9923 | 0.9811 | 0.1039 | 0.9914 |
| M_XS2 | 0.9746 | 0.9865 | -0.1366 | 0.9863 |
| M_XS3 | -0.0229 | -0.0516 | 0.9093 | -0.038 |
| PAN | 0.9935 | 0.9956 | -0.1001 | 1 |
| Entropy | XS1 | XS2 | XS3 | Average |
| Image B | 7.1949 | 7.4031 | 7.2862 | 7.2947 |
| Image D | 7.1976 | 7.4403 | 7.4755 | 7.3711 |
| Image A | 7.3711 | |||
| Variance of Noise | Variance of signal | ||
| Image B | XS1 | 1.808787 | 2718.728950 |
| XS2 | 1.187585 | 4012.562871 | |
| XS3 | 1.049842 | 2673.746792 | |
| Image D | XS1 | 1.239058 | 2313.589270 |
| XS2 | 1.316455 | 3342.328824 | |
| XS3 | 1.301243 | 2478.444206 | |
| Image A | 1.321812 | 3298.013340 | |
| mean length | Standard Deviation | Max. length | total length | length with max. probability | number of line seg. with max probability | total number | ||
| Image A | 12.58606 | 10.33859 | 161 | 35027 | 6 | 514 | 2783 | |
| image B | XS1 | 12.46353 | 10.68879 | 160 | 33153 | 6 | 543 | 2660 |
| XS2 | 12.49784 | 10.44948 | 163 | 34744 | 6 | 519 | 2780 | |
| XS3 | 12.15288 | 9.154931 | 118 | 31002 | 6 | 503 | 2551 | |
| image D | XS1 | 11.92341 | 9.594783 | 161 | 41720 | 6 | 746 | 3499 |
| XS2 | 11.44616 | 9.124911 | 161 | 47410 | 6 | 960 | 4142 | |
| XS3 | 10.55392 | 7.212286 | 162 | 54416 | 6 | 1257 | 5156 | |
Reference
- Shih-Hong Chio, Shu-Chia Wang (1996), Study on accuracy of foerstner operator for Feature Extraction 15th Sumposium on Surveying Technology and Application, pp. 667-676.
- Pai-When Shue, Yih-Hasing Tseng (1998), Data Registration and Fusion of Hyperspectral and SPOT images, Symposium on Air-Borne Remote Sensing techniques,pp.36-46.
- Kai-pe Tang (1995), study on Automatic Relative Orientation, master thesis, National Cheng Kung University.
- Chi-Wu Pen, Chue -tin pan (1991). Remote Sensing Cartography, Wuhan Technical University press of Surveying and Mapping.
- Chia- Sheng Shieh (1994), A Study on the Data fusion for SPOT Multispectral and Panchromatic Imagery, Master thesis, National Chiao Tung University.
- Canny J.(1986),"A Computational Approach to Edge Detection ".IEEE Transactions on PAMI, vol.PAMI-8, no.6. November 1986.
- Chavez, P.S., Jr., (1986), "Digital Merging of Landsat TM and Digitized NHAP data for 1:24,000- scale Image Mapping", Photogrammetric Engineering & Remote Sensing Vol. 52, No.10,pp. 1637-1646.
- Foerstner W.(1994), "A Framework for Low Level Feature Extraction", In EKLUNDH, J.-O(Ed), computer vision, ECCV'94, Vol. II. Pp.383-394, Lecture Notes in computer science, 801, Springer - Verlag, 1994.
- Lemmens M. (1986), " Survey on Stereo Matching Techniques", ISPRS, Com V, pp.11-23.
- Jensen, J.R. (1986), Introductory Digital Image Processing -A Remote Sensing Perspective, Prentice-Hall, New Jersey .
- Munechika, C.K.,J.S Warnick, C Salvaggio, and J.R Schott (1993), " Resolution Enhancement of Multispectral Image Data to Improve Classification Accuracy", photogrammetric Engineering & Remote Sensing Vol. 59,No 1, pp.67-72.
- Schowengerdt, R.A.(1997), Remote Sensing, Model and Methods fos Image for Processing ( Second Edition), Academic press.
- Vrabel, J.(1996), " Multispecral Imagery Band Sharpening Study", Photogrammetric engineering & remote Sensing, Vol. 62, No. 9,pp. 1075-1083.
- Yun Zhang, J. Albertz, (1997) " comparison of Four Different Methods to Merge Multisensor and Multiesolution Satellite Data for the Purpose of Mapping", ISPRS, VOL.17,pp.275-287.