| GISdevelopment.net ---> AARS ---> ACRS 1998 ---> Agriculture/Soil |
Paddy Rice Monitoring with
RADARSAT-1
S.Ross1, B.Brisco1, R.J. Brown2, S.Yun3, and G. Staples4
1Noetix Research Inc. 265 Carling Ave. Ottawa, ON K1S2E1
Tel (613)236-1555
2Canada Centre for Remote Sensing (CCRS),
588 Boot St., Ottawa, ON.K1A 0Y7
3Institute of Remote Sensing Applications,
Chinese of Science, Beijing, China
4Radarsat International,
3851 shell Rd., Richmond,
B.C., Canada V6X 2W2
Abstract
It is well known that rice is an important world crop, particularly in Asia. The population of Asia accounts for approximately 60% of the global population, about 92% of the world's rice production, and 90% of global rice consumption. With such a large population and high levels of rice consumption, an effective rice crop monitoring tool is needed. The unique capabilities of SAR (synthetic aperture radar) to penetrate clouds, haze and darkness allows for efficient and timely data collection which is useful for applications such as rice crop monitoring. Recent research has proven RADAR's capabilities to discriminate between rice and non-rice areas and has demonstrated great potential for more in-depth research of rice crops. RADARSAT, Canada's earth observation SAR satellite, offers several beam position allowing for frequent repeat coverage opportunities. This is important for monitoring highly dynamic and relatively quick growing crops such as rice. For this paper, seven RADARSAT images were acquired over a study area in Guangdong Province in southern china. The full rice crop growing season in this part of the world is 3 months. The acquired data set spans the full growing season with a more frequent acquisition schedule for the peak of the growth paddies in the area, and relate the results to the various growth stages of the plant-from flooded paddies, to full grown plants, to harvested areas.
1.0 Introduction and Background
The monitoring of the earth's surface with satellite imagery has, in the past, been largely dependent on the weather and time of day. Today, microwave sensors such as Canada's RADARSAT, are broadening the world of weather conditions. There are many applications of remote sensing imagery which can benefit from particularly dynamic phenomena such as crop monitoring (Brown et al., 1993; 1995). Rice is a very important plant because it provides a staple food for a large part of the world's population, especially in Asia. In some regions, it is also important economically as an export product. Since most rice producing regions, it is also important economically as an export product. Since most rice producing regions are found in tropical and sub-tropical regions with high amounts of rainfall and therefore cloud cover, the traditional approach of using vegetation indices in the visible and infra-red (VIR) region are not practical. The fragmented land cover and small size of many of the rice paddies also precludes the use of a low-resolution high repeat coverage sensor like NOAA's AVHRR which can often use a temporal composting technique to overcome the persistent cloud cover problem. Fortunately, the presence of water beneath the plant canopy, typical of paddy rice production systems, enhances the sensitivity of radar backscatter to rice (Le Toan et al., 1989; Aschbacher and Paudyal, 1993; Kurosu et al., 1993; Brisco et al., 1996; Le Toan et al., 1997). This is due to the domination of the backscatter process by canopy scattering and water surface-canopy interaction terms, because no direct surface contribution comes from the underlying water surface. Consequently, RADARSAT in particular and Synthetic Aperture Radar (SAR) satellite systems in general, are very promising tools fro developing a rice mapping and monitoring capability.
In most of China, the crop calendar for rice spans approximately three months. Figure 1 graphically demonstrates the 3 major stages of this growth cycle. The cycle begins with flooded rice paddies, into which young rice are transplanted early in the season. RADAR response at this stage is dark due to the small amount of scattering. The crop then mature and reach their peak growth stage around mid-cycle. The RADAR response from the growing rice plants increases as the plants grows in height and volume, and increase in moisture content. After the plants have fully matured, the moisture levels decrease, senescing begins, and the plants are harvested. There are wide varieties of harvesting techniques used, which can alter the spectral response at this stage in the cycle.
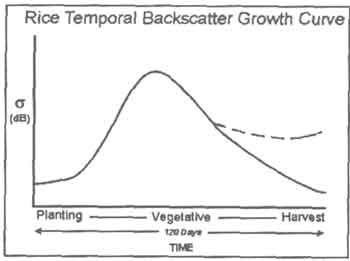
Figure 1: Rice Growth Curve
The purpose of this study is to assess radar's capability for detecting this growth curve based on the radar backscatter from rice targets over a full growth cycle.
2.0 Site and Data Description
2.1 Study Site
The study site is near the city of Zhao Qing (23°02'N, 112°29'E) in the Guangdong Province of South China. This area was used as a test site for the GlobeSAR project and numerous RADARSAT images of the area were acquired (Yun et al, 1995). The site is characterized by its flat topography and wide variety of agricultural crops and plants including rice, bananas, sugar cane, and euryale ferrox. The fields are generally small and are clearly delineated by the ditches, dikes and roadways which separate them. The weather is cloudy and rainy most of the year, making the soil moisture content quite high. This site has been used for studies in the past and is generally considered to be representative of most regions of southern China where rice production is the dominant representative of most regions of southern China where rice production is the dominant form of agriculture.
The diverse nature of the study site makes it in interesting target for RADAR. Figure 2 shows a RADARSAT image (beam mode S5) of the area of Zhao Qing. This image was acquired on June 5, 1997 at the peak of the growth cycle.
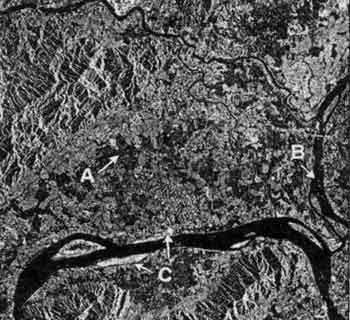
Figure 2: RADARSAT Image of Zhao Qing study site
Rice paddies are found throughout the region as non-uniformly shaped fields, ranging from 50-150 meters wide (A). Land cover classes such as banana crops and grasslands appear very bright as there is a lot of scattering effects related to signal interaction with the trees and large leaves. The response from targets produces a bright signal as seen at point C. The water targets, and aquaculture fields remain dark as a result of specular reflectance (B). There are many other land uses in this area of China, however for the purposes of this study, only the above mentioned classes will be considered.
2.2. Data
The data set used in this project was collected between April and July 1997 and represents a complete rice growing season from flooding to harvest. RADARSAT beam mode Stander 6 was collected every 24 days, based on the repeat orbit of the satellite. This provided a set of five images over the growing season. Due to the dynamic nature and rapid growth rate of rice crops, three more images (Standard 5) were collected between the peak and the end of the growing season to attain a more complete representation of the growth cycle. All the images are descending passes thus eliminating error due to diurnal and time of day effects. The table below summarizes the data collected and analyzed for this study.
Table 1: RADARSAT Data Set
A land cover map was provided by the Institute of Remote Sensing Applications (IRSA) in China. This map, along with ground data and crop type information, were used to determine sample sites of each of the land cover types which were then used for the extraction of the data.
As mentioned earlier, three main land cover classes were chosen for preliminary analysis: rice, bananas, and water. In addition, the response from grassland was considered, as well as a comparison of aquaculture and water targets. It was expected that the water (including aquaculture and river locations) would exhibit little or no change in its dark response throughout the temporal sequence. Similarly, the bananas were anticipated to remain bright throughout the period due to the unchanging nature of the canopy at this time of year. It was also expected that the dynamic nature of the rice growth curve would be seen in the spectral response of the crops over the time sequence. These three classes thus represent a good combination of expected target responses. The results of these hypotheses will be discussed in section 4.0.
3.0 Methodology
PCI software routines were used to read, process, enhance and manipulate the data. Quantitative analysis was done by calibrating the original data to obtain bo values. Using the PCI SAR Radiometric Calibration routine (PCI, 1997), applied LUTs were backed out and the image data was converted from DN (digital numbers) to radar brightness values(bo).
The images were then combined by collecting GCPs and registering all the images together using a cubic convolution. A sub-scene of the original images was then taken, in order to reduce the file size to a manageable level.
Bitmaps for each land cover class were then created using the land cover information provided by IRSA. As a preliminary study, 3-6 bitmaps were collected for each class. The statistical information under the bitmaps were converted to dB. The mean values of bo were determined for each class and for each image. Plots of these results were tehn created in order to observe the temporal change in land cover.
4.0 Preliminary Results
Preliminary results were determined by extracting dB values for known land cover classes, based on ground data provided by IRSA. The results obtained from this initial sampling process are promising (Fig. 3). The rice statistics show a change of 12 dB from the beginning of the growing season (April 1997) to mid-growing season (June 1997). For the second half of the growing season, numbers from the rice areas remain relatively constant at around -15 dB.
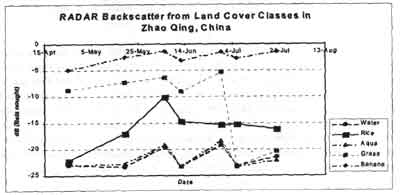
Figure 3: Temporal backscatter plot.
The banana areas provided expected results of consistently bright throughout the temporal sequence from April to July 1997. Signatures remained the -1 to -4 dB range.
Several samples for grassland areas were collected, mostly around shorelines. The results from these samples show a constant return of -5 dB to -8dB from April to late June, and then drop rapidly to -23 dB between June 24 and July 10. The imagery clearly shows a coast resulting in the significant and sudden decrease in backscatter response for the grass targets.
The water and aquaculture signatures remained constant between -20 dB and -24 dB throughout the sequence. However, there is a notable fluctuation, between scenes from May 19 to July 6. Because the jumps in return alternate between scenes, it is thought that the incidence angles may be an influencing factor since these scenes alternate between S5 and S6. There is currently research being carried out at the Canada Centre for Remote Sensing, which is developing and incidence angle correction process for RADARSAT data. As of yet, there are no final results related to water targets, however initial investigations related to other targets indicate that the degree of incidence angle effect is directly related to the roughness of the surface being imaged. In a study comparing the
Returns of several targets over different incidence angles, it was found that the urban areas (ie. High roughness value) showed little effect (around 1 dB) to varying incidence angles from 20o to 52o incidence angle (personal communication with T.Pultz, CCRS, 1998). Based on these results, it is not surprising to see a 3 dB change in backscatter return between differing incidence angles, for the water targets. Rougher targets such as the banana showed less than 2 dB changes between the S5 and S6 beam modes.
5.0 Discussion
This study looked at the RADAR response for several land cover classes in the region of Zhao Qing, China. The results of this investigation provided promising results and will allow the investigators to continue researching the applicability of RADARSAT for monitoring rice crops. It is hoped that the results presented here will assist in developing more operational capacities for RADARSAT data in terms of developing models to classify rice areas and estimate crop yields. There is an acknowledged need for more detailed research with a greater number of samples for each class, as well as determined incidence angle correction. These factors will be addressed as the research into using RADARSAT for rice crop monitoring continuses.
5.0 References
It is well known that rice is an important world crop, particularly in Asia. The population of Asia accounts for approximately 60% of the global population, about 92% of the world's rice production, and 90% of global rice consumption. With such a large population and high levels of rice consumption, an effective rice crop monitoring tool is needed. The unique capabilities of SAR (synthetic aperture radar) to penetrate clouds, haze and darkness allows for efficient and timely data collection which is useful for applications such as rice crop monitoring. Recent research has proven RADAR's capabilities to discriminate between rice and non-rice areas and has demonstrated great potential for more in-depth research of rice crops. RADARSAT, Canada's earth observation SAR satellite, offers several beam position allowing for frequent repeat coverage opportunities. This is important for monitoring highly dynamic and relatively quick growing crops such as rice. For this paper, seven RADARSAT images were acquired over a study area in Guangdong Province in southern china. The full rice crop growing season in this part of the world is 3 months. The acquired data set spans the full growing season with a more frequent acquisition schedule for the peak of the growth paddies in the area, and relate the results to the various growth stages of the plant-from flooded paddies, to full grown plants, to harvested areas.
1.0 Introduction and Background
The monitoring of the earth's surface with satellite imagery has, in the past, been largely dependent on the weather and time of day. Today, microwave sensors such as Canada's RADARSAT, are broadening the world of weather conditions. There are many applications of remote sensing imagery which can benefit from particularly dynamic phenomena such as crop monitoring (Brown et al., 1993; 1995). Rice is a very important plant because it provides a staple food for a large part of the world's population, especially in Asia. In some regions, it is also important economically as an export product. Since most rice producing regions, it is also important economically as an export product. Since most rice producing regions are found in tropical and sub-tropical regions with high amounts of rainfall and therefore cloud cover, the traditional approach of using vegetation indices in the visible and infra-red (VIR) region are not practical. The fragmented land cover and small size of many of the rice paddies also precludes the use of a low-resolution high repeat coverage sensor like NOAA's AVHRR which can often use a temporal composting technique to overcome the persistent cloud cover problem. Fortunately, the presence of water beneath the plant canopy, typical of paddy rice production systems, enhances the sensitivity of radar backscatter to rice (Le Toan et al., 1989; Aschbacher and Paudyal, 1993; Kurosu et al., 1993; Brisco et al., 1996; Le Toan et al., 1997). This is due to the domination of the backscatter process by canopy scattering and water surface-canopy interaction terms, because no direct surface contribution comes from the underlying water surface. Consequently, RADARSAT in particular and Synthetic Aperture Radar (SAR) satellite systems in general, are very promising tools fro developing a rice mapping and monitoring capability.
In most of China, the crop calendar for rice spans approximately three months. Figure 1 graphically demonstrates the 3 major stages of this growth cycle. The cycle begins with flooded rice paddies, into which young rice are transplanted early in the season. RADAR response at this stage is dark due to the small amount of scattering. The crop then mature and reach their peak growth stage around mid-cycle. The RADAR response from the growing rice plants increases as the plants grows in height and volume, and increase in moisture content. After the plants have fully matured, the moisture levels decrease, senescing begins, and the plants are harvested. There are wide varieties of harvesting techniques used, which can alter the spectral response at this stage in the cycle.
Figure 1: Rice Growth Curve
The purpose of this study is to assess radar's capability for detecting this growth curve based on the radar backscatter from rice targets over a full growth cycle.
2.0 Site and Data Description
2.1 Study Site
The study site is near the city of Zhao Qing (23°02'N, 112°29'E) in the Guangdong Province of South China. This area was used as a test site for the GlobeSAR project and numerous RADARSAT images of the area were acquired (Yun et al, 1995). The site is characterized by its flat topography and wide variety of agricultural crops and plants including rice, bananas, sugar cane, and euryale ferrox. The fields are generally small and are clearly delineated by the ditches, dikes and roadways which separate them. The weather is cloudy and rainy most of the year, making the soil moisture content quite high. This site has been used for studies in the past and is generally considered to be representative of most regions of southern China where rice production is the dominant representative of most regions of southern China where rice production is the dominant form of agriculture.
The diverse nature of the study site makes it in interesting target for RADAR. Figure 2 shows a RADARSAT image (beam mode S5) of the area of Zhao Qing. This image was acquired on June 5, 1997 at the peak of the growth cycle.
Figure 2: RADARSAT Image of Zhao Qing study site
Rice paddies are found throughout the region as non-uniformly shaped fields, ranging from 50-150 meters wide (A). Land cover classes such as banana crops and grasslands appear very bright as there is a lot of scattering effects related to signal interaction with the trees and large leaves. The response from targets produces a bright signal as seen at point C. The water targets, and aquaculture fields remain dark as a result of specular reflectance (B). There are many other land uses in this area of China, however for the purposes of this study, only the above mentioned classes will be considered.
2.2. Data
The data set used in this project was collected between April and July 1997 and represents a complete rice growing season from flooding to harvest. RADARSAT beam mode Stander 6 was collected every 24 days, based on the repeat orbit of the satellite. This provided a set of five images over the growing season. Due to the dynamic nature and rapid growth rate of rice crops, three more images (Standard 5) were collected between the peak and the end of the growing season to attain a more complete representation of the growth cycle. All the images are descending passes thus eliminating error due to diurnal and time of day effects. The table below summarizes the data collected and analyzed for this study.
| Date Beam | q | Growth Stage | |
| 04/25/97 | S6 | q=41°-46° | Flooded/Planted |
| 05/19/97 | S6 | q=41°-46° | Planted |
| 06/05/97 | S5 | q=36°-42° | Vegetative |
| 06/12/97 | S6 | q=41°-46° | Vegetative |
| 06/29/97 | S5 | q=36°-42° | Harvested |
| 07/06/97 | S6 | q=41°-46° | Harvested |
| 07/23/97 | S5 | q=36°-42° | Harvested |
A land cover map was provided by the Institute of Remote Sensing Applications (IRSA) in China. This map, along with ground data and crop type information, were used to determine sample sites of each of the land cover types which were then used for the extraction of the data.
As mentioned earlier, three main land cover classes were chosen for preliminary analysis: rice, bananas, and water. In addition, the response from grassland was considered, as well as a comparison of aquaculture and water targets. It was expected that the water (including aquaculture and river locations) would exhibit little or no change in its dark response throughout the temporal sequence. Similarly, the bananas were anticipated to remain bright throughout the period due to the unchanging nature of the canopy at this time of year. It was also expected that the dynamic nature of the rice growth curve would be seen in the spectral response of the crops over the time sequence. These three classes thus represent a good combination of expected target responses. The results of these hypotheses will be discussed in section 4.0.
3.0 Methodology
PCI software routines were used to read, process, enhance and manipulate the data. Quantitative analysis was done by calibrating the original data to obtain bo values. Using the PCI SAR Radiometric Calibration routine (PCI, 1997), applied LUTs were backed out and the image data was converted from DN (digital numbers) to radar brightness values(bo).
The images were then combined by collecting GCPs and registering all the images together using a cubic convolution. A sub-scene of the original images was then taken, in order to reduce the file size to a manageable level.
Bitmaps for each land cover class were then created using the land cover information provided by IRSA. As a preliminary study, 3-6 bitmaps were collected for each class. The statistical information under the bitmaps were converted to dB. The mean values of bo were determined for each class and for each image. Plots of these results were tehn created in order to observe the temporal change in land cover.
4.0 Preliminary Results
Preliminary results were determined by extracting dB values for known land cover classes, based on ground data provided by IRSA. The results obtained from this initial sampling process are promising (Fig. 3). The rice statistics show a change of 12 dB from the beginning of the growing season (April 1997) to mid-growing season (June 1997). For the second half of the growing season, numbers from the rice areas remain relatively constant at around -15 dB.
Figure 3: Temporal backscatter plot.
The banana areas provided expected results of consistently bright throughout the temporal sequence from April to July 1997. Signatures remained the -1 to -4 dB range.
Several samples for grassland areas were collected, mostly around shorelines. The results from these samples show a constant return of -5 dB to -8dB from April to late June, and then drop rapidly to -23 dB between June 24 and July 10. The imagery clearly shows a coast resulting in the significant and sudden decrease in backscatter response for the grass targets.
The water and aquaculture signatures remained constant between -20 dB and -24 dB throughout the sequence. However, there is a notable fluctuation, between scenes from May 19 to July 6. Because the jumps in return alternate between scenes, it is thought that the incidence angles may be an influencing factor since these scenes alternate between S5 and S6. There is currently research being carried out at the Canada Centre for Remote Sensing, which is developing and incidence angle correction process for RADARSAT data. As of yet, there are no final results related to water targets, however initial investigations related to other targets indicate that the degree of incidence angle effect is directly related to the roughness of the surface being imaged. In a study comparing the
Returns of several targets over different incidence angles, it was found that the urban areas (ie. High roughness value) showed little effect (around 1 dB) to varying incidence angles from 20o to 52o incidence angle (personal communication with T.Pultz, CCRS, 1998). Based on these results, it is not surprising to see a 3 dB change in backscatter return between differing incidence angles, for the water targets. Rougher targets such as the banana showed less than 2 dB changes between the S5 and S6 beam modes.
5.0 Discussion
This study looked at the RADAR response for several land cover classes in the region of Zhao Qing, China. The results of this investigation provided promising results and will allow the investigators to continue researching the applicability of RADARSAT for monitoring rice crops. It is hoped that the results presented here will assist in developing more operational capacities for RADARSAT data in terms of developing models to classify rice areas and estimate crop yields. There is an acknowledged need for more detailed research with a greater number of samples for each class, as well as determined incidence angle correction. These factors will be addressed as the research into using RADARSAT for rice crop monitoring continuses.
5.0 References
- Aschbacher, J., and D. Paudyal, 1993, "Studies of Rice in Thailand using ERS-1 Data", n Proceeding for the National Conference on ERS-1/Landsat/SPOT Applications: A Complimentary Approach, 23-25, November, Jakarta, Indonesia.
- Brakke, T.W., E.T. Kanemasu, and J.L. Steiner, 1981, "Microwave Radar Response to Canopy Moisture, Leaf-Area Index, and Dry Weight of Wheat, Corn and Sorghum", in Remote Sens. Environ, Vol. 11.pp. 207-220.
- Brisco, B., R.J. Brown, G. Staples and D. Nazarenko, 1995, "Potential Rice Identification and Monitoring with RADARSAT", in Proceedings of the 17th Canadian Symposium on Remote Sensing, Vol. 2. pp. 474-479.
- Brown, R.J. B.Brisco, M. D'Iorio, C. Prevost, R.A. Ryerson and V.Singhroy., 1996, "RADARSAT Applications: Review of GlobeSAR Program", in Canadian Journal of Remote Sensing, Vol. 22, No. 4. pp. 404-419.
- Le Toan, T,H. Laur, E. Mougin and A. Lopes, 1989, "Multitemporal and Dual Polarisation Observations of Agricultural Vegetation Covers By X-Band SAR Images" in IEEE Trans Geosci. Remoe Sensing. Vol. 27.pp. 709-717.
- Le Toan, T., F. Ribbes, L. Wang, N. Floury, K, Ding, J. Kong, M. Fujita and T. Kurosu, 1997, "Rice Crop Mapping and Monitoring Using ERS-1 Data Based on Experiment and Modeling Results" in IEEE Trans Geosci. Remote Sensing. Vol. 35, NO. 1. pp. 41-56.
- PCI Enterprises Inc., 1997, "SAR Radiometric Correction", in RadarSoft Course notes. pp. 80-91.
- RSI (RADARSAT International), 1996, "RADARSAT Illuminated. Your Guide to Products & Services", RADARSAT user guide produced by RSI.
- Shepherd, N., 1997, "Extraction of Beta Nought and Sigma Nought from RADARSAT CDPF Products", in Proceedings of a Workshop on RADARSAT Image Quality: CEOS.