| GISdevelopment.net ---> AARS ---> ACRS 1998 ---> Agriculture/Soil |
Correlation of Spectral
Reflectance to Growth in Rice Vegetation
Chwen-Ming Yang and Muh-Rong Su
Department of Agronomy,
Taiwan Agricultural Research Insitute
189 Chung-Cheng Road, Wufeng,
Taichung Hsien, Taiwan 41301, ROC
Tel : (886)-4-330-2301 ext. Fax: (886)-4-330-2806
E-mail: cmyang@wufeng.tari.gov.tw
Chwen-Ming Yang and Muh-Rong Su
Department of Agronomy,
Taiwan Agricultural Research Insitute
189 Chung-Cheng Road, Wufeng,
Taichung Hsien, Taiwan 41301, ROC
Tel : (886)-4-330-2301 ext. Fax: (886)-4-330-2806
E-mail: cmyang@wufeng.tari.gov.tw
Abstract
Multispectral data from aircraft or satellite have been widely used in agriculture as well as in other industrial sectors. To connect such data with vegetation cover for agricultural applications, generally a detailed and through ground-based should be made to characterize radiance and reflectance spectra and link it with growth and yield traits. This study was to remotely measure and monitor the seasonal variations in reflectance spectrum, in the range of 350-1100 nm, of rice (Oryza sativa L. cv. Tainung 67) canopy at the experimental field of Taiwan Agricultural Research Institute (TARI) during the cropping seasons in 1996-1997. The objectives were to examine relationship between growth traits and NDVI and to assess their potential use in estimating growth of rice crop. Attempts were also made to compare NDVI calculated from narrow-band ground-based spectral measurement and the simulated board-band multispectral satellite data. The physiological and morphological implications of the relationships were discussed.
Introduction
Satellite or aircraft remote sensing can provide a timely spatial distribution information on crop performance and be incorporated into farm management scheme. Application such as precision farming activities, growth and production estimation, and land surface characteristics evaluation are made possible (Maas, 1998). Before these practical applications, vegetation spectral properties from remote sensing must be in connection with some physical characters of plant canopy so that plant performance can reasonably be assessed. Mathematical formulae are then established from the fitting curves of these paired variables. Leaf area index (LAI), percent vegetation cover, and unit area plant biomass are among physical characters commonly used as indicators of the status of crops (Maas, 1998; Wiegand et al., 1992; Yang and Su, 1998).
Vegetation indices are mathematical transformations intended to estimate the spectral contribution of crop vegetation to multispectral observations (Elvidge and Chen, (1995). The transformations have the effect of normalizing measurements acquired from varied environmental conditions. The formulae are derived mostly from discrete green, red and near-infrared bands, especially the two ends of the so-called chlorophyll red-edge (Jackson et al., 1983; Tucker, 1979). By correlating vegetation indices with physical characters of plant canopy, changes of vegetation feature can be potentially assessed and predicted from values of vegetation indices during the growing season (Maas, 1998; Tucker et al., 1979; Yang and Su, 1997).
In this study, variations in reflectance spectrum were monitored and analyzed and the normalized difference vegetation index (NDVI) were calculated from the ground-based remotely sensed spectral measurements of rice canopy for the growing seasons of 1996-1997. An simplified vegetation model for estimating crop growth traits from NDVI is presented, and the simulated broad-band versions of NDVI were compared with the narrow-band counterparts.
Materials and Methods
Experiments were conducted at TARI Experimental Farm (23o30'N, 120o42' E, elevation of 85 m) on a loam soil (nonacid, hyperthermic, Fluvaquentic Dystrochrept) during First and Second crops of 1996 and 1997. Cultivation and fertilization were in consistent with the existing cultural practices for rice adopted by the local region. Each season had 3 plots as replications and were furrow-irrigated. Herbicide and hand-weeding were practiced to avoid weed interference. Plants were sampled from 2 wk after transplanting till harvest periodically. Leaf area was determined and LAI, defined as the area of green leaves per unit area of land, was computed at each sampling. Leaf dry weight (LDW) was measured after oven-dried at 80oC for 72 h. Means were used for regression analyses to examine the correlation between growth traits and NDVI.
Method of spectral measurements was reported in the previous papers (Yang and Su, 1997, 1998). Spectral irradiance of the dense vegetation cover and incident solar radiation in the range of 350 to 1100 nm was measured using a LI-1800 high spectral resolution portable spectroadiometer (LI-COR inc., Nebraska, USA). The sensor head was pointed downward in a nadir-viewing and was placed horizontally 1.0 m above rice vegetation surface to scan the upward reflected radiation. Measurements were made at each plot using sunlight as illumination source on clear or near cloudless days between 11:00 to 12:00 local standard time. Date were averaged and mean values were used.
Radiance spectra of sunlight were taken before and after each replicate measurement and the average was used as the reflectance standard. Reflectance of individual wavelength was calculated by dividing the vegetation radiance measurements with the corresponding incident solar radiation measurement with the corresponding incident solar radiation measurements. Reflectance spectra measured during the growth were grouped for each crop and the standard errors of individual wavelengths were calculated as representative of the upper and lower boundaries. The NDVI was defined as (NIR-RED)/(NIR+RED). The reflectance of the wavelengths at RED (674 nm) and NIR (754 nm) measured from LI-1800 were selected and used for calculations. Regression analysis were performed to generate fitting-curves in order to monitoring seasonal changes of NDVI as well as growth traits.
From narrow-band reflectance spectra, broad-band RED and NIR reflectance were computed. The reflectance simulated for RED and NIR for HRV sensors of French SPOT program were derived from the 2-nm-wide narrow-band LI-1800 spectra in bandpasses of 610-680 nm and 790-890 nm. For MSS sensor system of Landsat series, bandpasses in the range of 600-700 nm and 700-800 nm were computed to simulated Band 2 and Band 3, respectively. The averaged values were presented for RED and NIR bands of the broad-band sensors. Linear regression was performed to compare the difference in NDVI between values calculated from single reflectance and band reflectance.
Results and Discussion
For a typical reflectance spectrum, wavebands in the visible region were mostly absorbed by chlorphylls while wavelengths in NIR were reflected significantly because of the absence of absorption (Gausman st al., 1969). It was shown similar in seasoanl pattern of reflectance spectrum but was shifted by weather and soil impact (Fig 1). Variations were found much greater in the early growth and maturing stages than during the long middle period of the growing season. The greater standard errors graphed in the 1st crop of 1997 inferring a stronger climate oscillation occuring in the growing period. These 'environmental' and 'growth' effects influencing the time-seqential performance of canopy reflectance spectra were also found in many field crops (Masoni st al., 1996; Sinclair et al., 1971; Yang Ko, 1998).
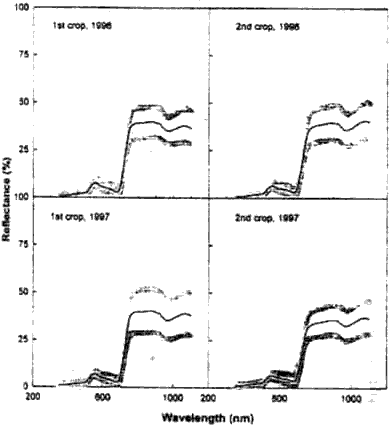
Figure 1: Seasonal variations in reflectance spectra of rice vegetation cover over the cropping seasons of 1996 and 1997. The upper and lower levels are the intervals of standard errors.
Fig. 2 shows that NDVI curve reached the peak near heading, and then fell off as the growing season continued. It can be accounted for by the seasonal trends of reflectance at 674 and 764 nm, the increasing or decreasing difference between RED and NIR reflectance giving a corresponding upward or downstream NDVI. RED reflectance decreased with time beacause of increased chlorophyll absorption by increased green vegatation (Tucker et al., 1979). As growth diminished and senescence began, RED reflectance started to increase. It was reversed for NIR reflectance. The NIR bands are essentially unabsorbed by foliage and are mostly transmitted and reflected with vegetation structure (Sinclair st al., 1971). Ashley and Rea (1975) observed the similar results following the ground foliage production and used it to depict phennological change.
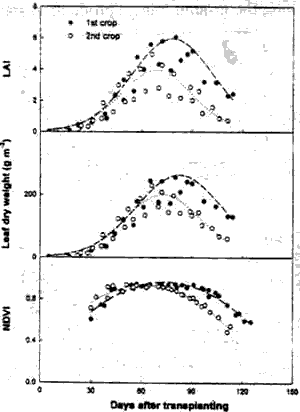
Figure 2: Seasonal changes in leaf area index (LAI) and leaf dry weight and the normalized difference vegetation index (NDVI) of rice vegetation over the cropping seasons of 1996 and 1997.
The increase and decrease of NDVI of NDVI followed the changes of growth traits (Fig. 2). It suggests that NDVI is sensitive to the amount of photosynthetically active vegetation and may be a superior variable for monitoring vegetation. Fig. 3 further shows that relations of these growth traits and NDVI were height. Changes of NDVI agree well with the cnages of canopy cover (up to LAI of ca. 5.5) and foliage biomass (up to LDW of ca. 240 gm-2), indication a strong association of percent vegetation cover and plant chlorosis with NDVI. Tucker (1979) had a similar result, showing that NDVI was sensitive primarily to the green leaf area of green leaf biomass. Curran (1983) estimated LAI from RED and NIR reflectance measurements by correlating LAI with ratio vegetation index.
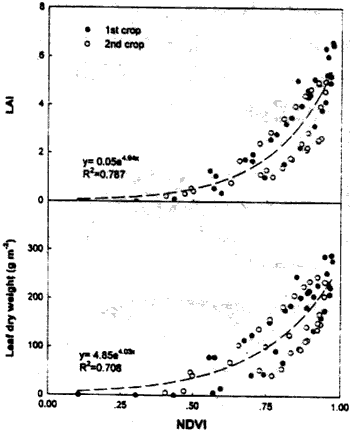
Figure 3: The curvilinear relationships between leaf area index (LAI) and leaf dry weight and the normalized difference vegetation index (NDVI) of rice vegetation over the cropping seasons of 1996 and 1997.
By separating NDVI into an uprising growth part (vegetative phase) and a downsizing maturing part (reproductive phase), growth transition are distincted from the maximum point of NDVI (Fig. 4). While for a given value of growth trait, there are two corresponding points of NDVI be measured at two different growth phase. In the vegetative phase, the rapid increase in vegetative canopy prior to heading was manifested by an exponential increase in NDVI. The NDVI reached a plateau when canopy cover was complete. During late season, decline of NDVI was responsive to the onset of chlorosis due to crop maturation. For a précised estimation of canopy status, relationship between growth traits and NDVI should be carefully classified. Because the relationship are adversely influenced by senescence, it would be better not to assess growth traits in the early and the late stages of plant development (Ahlrichs and Bauer, 1983). As the sustainability of full vegetative cover is an important factor in determining the final yield, the spectral assessment of the development stages is crucial (Tucker et al., 1979).
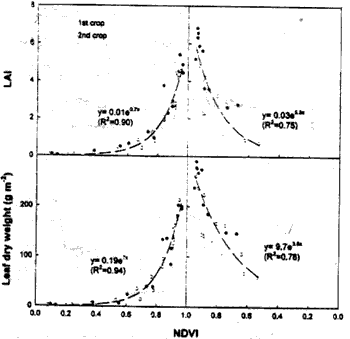
Figure 4: Correlations of leaf area index (LAI) and leaf dry weight to the normalized difference vegetation index (NDVI) over the cropping seasons of 1996 and 1997.
To examine whether satellite broad-band data can be used to substitute for ground-based narrow-band measurements, a linear regression analysis was performed (Fig. 5). The broad-band versions of NDVI agree very well (R2=0.982 for SPOT and R2=0.985 for LANDSAT) with the narrow-band counterparts. As these spectral transformations are highly correlated, estimation of growth traits based on NDVI can be fairly accurate for both narrow-band data and spectral inputs collected from satellite. Thus, the reflectance band of the HRV and MSS sensors could be used as predictors of canopy characters. With many more interacting variables, spectral data measured from satellite remote sensing are considered more complicated than those from the ground platform.
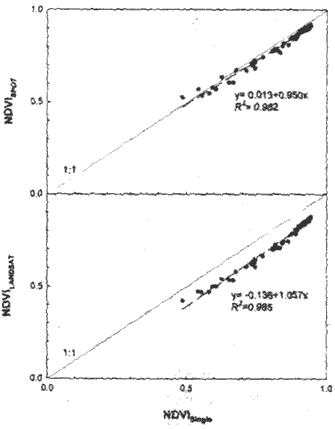
Figure 5: The linear relationships between NDVI calculated from band reflectance (NDVISPOT and NDVINDVI and NDVI calculated from single reflectance NDVI Single
References
Multispectral data from aircraft or satellite have been widely used in agriculture as well as in other industrial sectors. To connect such data with vegetation cover for agricultural applications, generally a detailed and through ground-based should be made to characterize radiance and reflectance spectra and link it with growth and yield traits. This study was to remotely measure and monitor the seasonal variations in reflectance spectrum, in the range of 350-1100 nm, of rice (Oryza sativa L. cv. Tainung 67) canopy at the experimental field of Taiwan Agricultural Research Institute (TARI) during the cropping seasons in 1996-1997. The objectives were to examine relationship between growth traits and NDVI and to assess their potential use in estimating growth of rice crop. Attempts were also made to compare NDVI calculated from narrow-band ground-based spectral measurement and the simulated board-band multispectral satellite data. The physiological and morphological implications of the relationships were discussed.
Introduction
Satellite or aircraft remote sensing can provide a timely spatial distribution information on crop performance and be incorporated into farm management scheme. Application such as precision farming activities, growth and production estimation, and land surface characteristics evaluation are made possible (Maas, 1998). Before these practical applications, vegetation spectral properties from remote sensing must be in connection with some physical characters of plant canopy so that plant performance can reasonably be assessed. Mathematical formulae are then established from the fitting curves of these paired variables. Leaf area index (LAI), percent vegetation cover, and unit area plant biomass are among physical characters commonly used as indicators of the status of crops (Maas, 1998; Wiegand et al., 1992; Yang and Su, 1998).
Vegetation indices are mathematical transformations intended to estimate the spectral contribution of crop vegetation to multispectral observations (Elvidge and Chen, (1995). The transformations have the effect of normalizing measurements acquired from varied environmental conditions. The formulae are derived mostly from discrete green, red and near-infrared bands, especially the two ends of the so-called chlorophyll red-edge (Jackson et al., 1983; Tucker, 1979). By correlating vegetation indices with physical characters of plant canopy, changes of vegetation feature can be potentially assessed and predicted from values of vegetation indices during the growing season (Maas, 1998; Tucker et al., 1979; Yang and Su, 1997).
In this study, variations in reflectance spectrum were monitored and analyzed and the normalized difference vegetation index (NDVI) were calculated from the ground-based remotely sensed spectral measurements of rice canopy for the growing seasons of 1996-1997. An simplified vegetation model for estimating crop growth traits from NDVI is presented, and the simulated broad-band versions of NDVI were compared with the narrow-band counterparts.
Materials and Methods
Experiments were conducted at TARI Experimental Farm (23o30'N, 120o42' E, elevation of 85 m) on a loam soil (nonacid, hyperthermic, Fluvaquentic Dystrochrept) during First and Second crops of 1996 and 1997. Cultivation and fertilization were in consistent with the existing cultural practices for rice adopted by the local region. Each season had 3 plots as replications and were furrow-irrigated. Herbicide and hand-weeding were practiced to avoid weed interference. Plants were sampled from 2 wk after transplanting till harvest periodically. Leaf area was determined and LAI, defined as the area of green leaves per unit area of land, was computed at each sampling. Leaf dry weight (LDW) was measured after oven-dried at 80oC for 72 h. Means were used for regression analyses to examine the correlation between growth traits and NDVI.
Method of spectral measurements was reported in the previous papers (Yang and Su, 1997, 1998). Spectral irradiance of the dense vegetation cover and incident solar radiation in the range of 350 to 1100 nm was measured using a LI-1800 high spectral resolution portable spectroadiometer (LI-COR inc., Nebraska, USA). The sensor head was pointed downward in a nadir-viewing and was placed horizontally 1.0 m above rice vegetation surface to scan the upward reflected radiation. Measurements were made at each plot using sunlight as illumination source on clear or near cloudless days between 11:00 to 12:00 local standard time. Date were averaged and mean values were used.
Radiance spectra of sunlight were taken before and after each replicate measurement and the average was used as the reflectance standard. Reflectance of individual wavelength was calculated by dividing the vegetation radiance measurements with the corresponding incident solar radiation measurement with the corresponding incident solar radiation measurements. Reflectance spectra measured during the growth were grouped for each crop and the standard errors of individual wavelengths were calculated as representative of the upper and lower boundaries. The NDVI was defined as (NIR-RED)/(NIR+RED). The reflectance of the wavelengths at RED (674 nm) and NIR (754 nm) measured from LI-1800 were selected and used for calculations. Regression analysis were performed to generate fitting-curves in order to monitoring seasonal changes of NDVI as well as growth traits.
From narrow-band reflectance spectra, broad-band RED and NIR reflectance were computed. The reflectance simulated for RED and NIR for HRV sensors of French SPOT program were derived from the 2-nm-wide narrow-band LI-1800 spectra in bandpasses of 610-680 nm and 790-890 nm. For MSS sensor system of Landsat series, bandpasses in the range of 600-700 nm and 700-800 nm were computed to simulated Band 2 and Band 3, respectively. The averaged values were presented for RED and NIR bands of the broad-band sensors. Linear regression was performed to compare the difference in NDVI between values calculated from single reflectance and band reflectance.
Results and Discussion
For a typical reflectance spectrum, wavebands in the visible region were mostly absorbed by chlorphylls while wavelengths in NIR were reflected significantly because of the absence of absorption (Gausman st al., 1969). It was shown similar in seasoanl pattern of reflectance spectrum but was shifted by weather and soil impact (Fig 1). Variations were found much greater in the early growth and maturing stages than during the long middle period of the growing season. The greater standard errors graphed in the 1st crop of 1997 inferring a stronger climate oscillation occuring in the growing period. These 'environmental' and 'growth' effects influencing the time-seqential performance of canopy reflectance spectra were also found in many field crops (Masoni st al., 1996; Sinclair et al., 1971; Yang Ko, 1998).
Figure 1: Seasonal variations in reflectance spectra of rice vegetation cover over the cropping seasons of 1996 and 1997. The upper and lower levels are the intervals of standard errors.
Fig. 2 shows that NDVI curve reached the peak near heading, and then fell off as the growing season continued. It can be accounted for by the seasonal trends of reflectance at 674 and 764 nm, the increasing or decreasing difference between RED and NIR reflectance giving a corresponding upward or downstream NDVI. RED reflectance decreased with time beacause of increased chlorophyll absorption by increased green vegatation (Tucker et al., 1979). As growth diminished and senescence began, RED reflectance started to increase. It was reversed for NIR reflectance. The NIR bands are essentially unabsorbed by foliage and are mostly transmitted and reflected with vegetation structure (Sinclair st al., 1971). Ashley and Rea (1975) observed the similar results following the ground foliage production and used it to depict phennological change.
Figure 2: Seasonal changes in leaf area index (LAI) and leaf dry weight and the normalized difference vegetation index (NDVI) of rice vegetation over the cropping seasons of 1996 and 1997.
The increase and decrease of NDVI of NDVI followed the changes of growth traits (Fig. 2). It suggests that NDVI is sensitive to the amount of photosynthetically active vegetation and may be a superior variable for monitoring vegetation. Fig. 3 further shows that relations of these growth traits and NDVI were height. Changes of NDVI agree well with the cnages of canopy cover (up to LAI of ca. 5.5) and foliage biomass (up to LDW of ca. 240 gm-2), indication a strong association of percent vegetation cover and plant chlorosis with NDVI. Tucker (1979) had a similar result, showing that NDVI was sensitive primarily to the green leaf area of green leaf biomass. Curran (1983) estimated LAI from RED and NIR reflectance measurements by correlating LAI with ratio vegetation index.
Figure 3: The curvilinear relationships between leaf area index (LAI) and leaf dry weight and the normalized difference vegetation index (NDVI) of rice vegetation over the cropping seasons of 1996 and 1997.
By separating NDVI into an uprising growth part (vegetative phase) and a downsizing maturing part (reproductive phase), growth transition are distincted from the maximum point of NDVI (Fig. 4). While for a given value of growth trait, there are two corresponding points of NDVI be measured at two different growth phase. In the vegetative phase, the rapid increase in vegetative canopy prior to heading was manifested by an exponential increase in NDVI. The NDVI reached a plateau when canopy cover was complete. During late season, decline of NDVI was responsive to the onset of chlorosis due to crop maturation. For a précised estimation of canopy status, relationship between growth traits and NDVI should be carefully classified. Because the relationship are adversely influenced by senescence, it would be better not to assess growth traits in the early and the late stages of plant development (Ahlrichs and Bauer, 1983). As the sustainability of full vegetative cover is an important factor in determining the final yield, the spectral assessment of the development stages is crucial (Tucker et al., 1979).
Figure 4: Correlations of leaf area index (LAI) and leaf dry weight to the normalized difference vegetation index (NDVI) over the cropping seasons of 1996 and 1997.
To examine whether satellite broad-band data can be used to substitute for ground-based narrow-band measurements, a linear regression analysis was performed (Fig. 5). The broad-band versions of NDVI agree very well (R2=0.982 for SPOT and R2=0.985 for LANDSAT) with the narrow-band counterparts. As these spectral transformations are highly correlated, estimation of growth traits based on NDVI can be fairly accurate for both narrow-band data and spectral inputs collected from satellite. Thus, the reflectance band of the HRV and MSS sensors could be used as predictors of canopy characters. With many more interacting variables, spectral data measured from satellite remote sensing are considered more complicated than those from the ground platform.
Figure 5: The linear relationships between NDVI calculated from band reflectance (NDVISPOT and NDVINDVI and NDVI calculated from single reflectance NDVI Single
References
- Ahlriches, J.S. and M.E. Bauer. 1983. Relation of agronomic and multispectral reflectance characteristics of spring wheat. Agron. J. 75: 987-993.
- Ashley, M.D. and J. Rea. 1975. Seasonal vegetation differences from ERTS imagery. Photogram. Engr. And Remote Sens. 41:713-719.
- Curran, P.J. 1983. Multispectral remote sensing for the estimation of green leaf index. Philoosoph. Trans. Royal Soc. London, Series A 309:257-270.
- Elvidge, C.D. and Z. Chen, 1995. Comparison of broad-band and narrow-band red and near-infrared vegetation indices. Remote Sens. Environ. 54:38-48.
- Gausman, H.W., W.A. Allen, V.I. Myers and R. Cardenas. 1969. Reflectance and internal structure of cotton leaves, Gosypium hirsutum L. Agron. J. 61:374-376.
- Jackson, R.D., P.N. Slater and P.J. Pinter. 1983. Discrimination of growth and water stress in wheat by various vegetation indices through a clear and a turbid atmosphere. Remote Sens. Environ. 13:187-208.
- Maas, S. J. 1998. Estimating cotton canopy ground cover from remotely sensed scene reflectance. Agron. J. 90:384-388.
- Masoni, A., L. Ercoli and M. Mariotti. 1996. Spectral properties of leaves deficient in iron, sulfur, magnesium, and manganese. Agron. J. 88:937-943.
- Sinclair, T.R., R.M. Hoffer and M.M. Schreiber. 1971. Reflectance and internal structure of leaves from several crops during a growing season. Agron. J. 63:864-868.
- Tucker, C.J. 1979. Red and photographic infrared linear combinations for monitoring vegetation. Remote Sens. Environ. 8:127-150.
- Tucker, C.J.,J.H. Elgin, Jr., J.E. McMurtrey III and C.J. Fan. 1979. Monitoring corn and soybean crop development with hand-held radiometer spectral data. Remote Sens. Envrion. 8:237-248.
- Wiegand, C.L., A.H. Gerbermann, K.P. Gallo, B.L. Bland and D. Dusek. 1990. Multisite analyses of spectral-biophysical data for corn. Remote Sens. Environ. 33:1-16.
- Wiegand, C.L.S.J. Maas, J.K. Aase, J.L. Hatfield, P.J. Pinter, Jr., R.D. Jackson, E.T. Kanemasu and R.L. Lapitan. 1992. Multisite analysis of spectral-biophysical data for wheat. Remote Sens. Environ. 42:1-21.
- Yang, C.-M and M.-R. Su. 1997. Analysis of reflectance spectrum of rice canopy. (in Chinese) Chinese J. Agromet. 4:87-95.
- Yang, C.-M. and C.-C.Ko. 1998. Seasonal changes in canopy spectra of sweet potato. J. Photogram. Remote Sens. 3:13-28.
- Yang, C.-M. and M.-R. Su. 1998. Seasonal variations of reflectance spectrum and vegetation index in rice vegetation cover. In: Proceed. 3rd Asian Crop Sci. Conf. 27 April-2 May, 1998, Natl. Museum of Natural Sci., Taiwan (ROC). (in press)