| GISdevelopment.net ---> AARS ---> ACRS 1997 ---> Water Resources |
Pergau Reservoir Information
System (PRIS) For Mapping and Sedimentaion Studies: A Study on the
Development of the Reservoir Database
Majid Kadir, Ghazali Desa
& Tajul Ariffin Musa
Faculty of Geoinformation Science and Engineering
University Teknoligi Malaysia (UTM)
Located Bag 791, 80990 Johor Bahru,
Malaysia
E-mail : dramajid@pc.jaring.my
Biography Faculty of Geoinformation Science and Engineering
University Teknoligi Malaysia (UTM)
Located Bag 791, 80990 Johor Bahru,
Malaysia
E-mail : dramajid@pc.jaring.my
Majid Kadir is currently an Associate Professor at the Faculty of Geoinformation Science and Engineering, UTM. His major research interest is in the area of GPS technology application.
Ghazali Desa is currently an Associate Professor at the Department of Geoinformatic, Faculty of Geoinformation Science and Engineering, UTM. His Current research interest is in the area of spatial database and digital photogrammetry.
Trajul Ariffin Musa is currently a tutor at the Faculty of Geoinformaiton Science Engineering, UTM. He is now pursuing his M.Sc. in the area of GPS and GIS integration.
Abstract
The main part of a hydroelectric project is the dam with its natural or man made lakes or reservoirs. As in the case of many tropical countries, heavy rainfally and effects of upstream changes in landuse have caused detrimental consequences on the sedimentation. Reservoir Information system, therefore, is recognized presetly as the most suitable and efficient tool to manage the reservoir. The present study will focus on Reservoir Information system for the Pergau Hydroelectric Project, which is located in the State of Kelantan, Malaysia. This paper presents the results of the first phase of the study, i.e. on the data sources and data acquisition techniques in order to develop the Pergau Reservoir Database. The Database will be the major component part of the Pergau Reservoier Information System (PRIS).
Introduction
As in the case in many tropical countries, heavy rainfall and effects of upstream changes in landuse have always caused detrimental consequences on reservoirs. Sedimentation and siltation of particles within the reservoir are the main problems that have been reported by many researchers (Nik et al., 1993). Deposition of this sediment could lessen the reservoir capacity and therefore affecting its economic life (Mustafa, 1987).
Therefore, effective management of reservoir is needed for the purpose of planning and carrying out remedial actions to problems associated within the reservoir. Current trend towards a more efficient management of reservoir is the application of Geographical Information System (GIS). (Meijerink 1990, suwanwerakamtorn 1994, Bishr & Radwan 1995). Application of GIS will create a system, which may be called a Reservoir Information System for gathering, storing, analyzing and displaying data regarding a particular reservoier. Database which contain all relevant information, is core of the Reservoier Information System.
The objective of this study is to develop a Reservoir Information System for the Pergau Hydroelectric Reservoir, which is located in the state of Kelantan, Malaysia. The study is divided into two phases; (1) the development of Pergau Reservoir Database, and (2) the development of Pergau Reservoir Information system (PRIS). However, this presentation will focus on the implementation of the Phase I of the study.
Study Area
Pergau reservoier is located within the Pergau watershed area, i.e., in the northwest region of the state of Kelantan, Malaysia. This watershed lies approximately within latitudes 5o 35' to 5o 38' N and longitudes 101o 38' to 101o 41' E. Northern part of the watershed is almost bordering with Thailand and the western part is bordering with the state of Perak. This watershed consists of an upper catchment and a lower plain covering an area of approximately 54 km2. The climate in this area is influenced by the northeast and southwest monsoons and annual rainfall is approximately 1200mm in the lower plain, but more in the hilly and mountainous area. Maximum rainfall occurs during septempber to January. The Pergau Reservoir was impounded in the late February 1996, soon after the completion of the Kuala Yong Dam.
Database Development
The use of a reservoir database linked to a GIS will considerably enhance the possibilities of satisfying users need through the capabilities of data processing and analysis, automated data sources and data acquisition techniques that have been used in the development of the Pergau Reservoir database.
Figure 1. Data Sources and Data Acquisition Techniques
Data Sources
- Aerial Photographs
Considering the size of the study area, this kind of data was found very suitable in achieving the necessary data for input to the reservoir database. The acquisition of aerial photographs was performed in April 1996. A total of 52 aerial photographs covering the entire reservoir and downstream area to Batu Melintang. The aerial photographs covering the entire reservoir and downstream area to Batu Melintang. The aerial photographs were taken with large format metric camera (230mm x 230mm). The camera used is a superwide angle lense cameraa with 88.32 mm focal length. The average flying height (H) is approximately 1000m. since that the project area is located in a very undulating terrain, the highest point is 925 m and the lowest point is 130 m above mean-sea-level. The average photo scale obtained is 1:25,000.
- Existing Map
As the study area low in development activity, land changes are not too critical. Therefore, the use of existing map as one of the data sources in the study was found very suitable and economic. The property and landuse boundaries were digitized from both of these maps in order to convert into digital format.
- GPS Surveying
GPS surveying technique has been utilized to establish Ground Control Points (GCP) for photo control and hydrographic surveying activity. Five Ashtech dual frequencies GPS receivers were used in the field surveys. The survey was designed so that a network capable of generating centimeter level accuracy for both horizontal and vertical are satisfied. In order to check the network consistency, ties to at least three GPS First Order Stations has been made. For the etermination of heights above mean-sea-level, ties also has been made to the existing leveling benchmarks located near the study area. The network is incrementally built and adjusted on a daily basis. Finally, the adjusted coordinates given in the WGS84 system are transformed into the local geographic coordinate (Kertau) system and eventually to the plane coordinate (Cassini) system.
- Integrated Hydrographic -GPS surveying
Hydrographic surveying is performed over the impounded area of Pergau Reservoir. Random data collection pattern has been adopted for the hydrographic surveying of the Pergau Reservoir area. Depth measurements was recorded using the echo-trace and adjusted with the tide value observed during the process. The hydrographic system used has the capability to integrate both the sounding and GPS positioning data through a notebook computer carry on-board the boat. Differential correction of the GPS positions was accomplished by establishing a base station atop the Pergau dam area.
- Photogrammetric Mapping
A modified Wild B8 analytical plotter using ADAM Technology Software was used to produce the topographical map. The analytical plotter has the capability to allow stereo- digitizing of the stereo-model of the aerial photographs. The ground control points obtained from the GPS surveying were used to orient Photogrammetric models before stereo-digitizing can be performed. The digital data obtained from the stereo -digitizing was incorporated with the reservoir bathymetric data to produce the complete digital topographic map. All the digital data was exported to AutoCAD software for editing purpose. The combination of both reservoir and hydrographic techniques generates the most accurate representation of the reservoir and downstream topographical information.
- Manual Digitizing
The existing property map (cadastral standard sheet) and landuse map have been transformed into the digital from by digitizing technique. The result of the digitizing process was incorporated into the digital topographic database as a different layer.
Generally, the data that entered into the database are of two types; spatial data and associated non-spatial attribute from by digitizing technique. The result of the digitizing process was incorporated into the digital topographic database as a difference layer.
- Positional Data
The spatial data that represent the geographic position of features has been stored in vector dataset. It contains a digital representation of the study area map, defines as a series of line(arc) and points (nodes) which combine to from a sequence of map units. Each map unit was defined by one or several polygons. The dataset have been structured in eitht major layers, reservoir and land contours, rivers, spot heights, roads, landuse and property polygons.
- Attribute Data
The non-spatial attribute data provide the descriptive information. Parts of the attribute data in this study were structured in tale's from. The relational database was used. The attribute data would be fed later into the reservoir information system as polygons identifiers and establish the linking between the graphic and alphanumeric database. At the moment, the attribute data consist of type and area of landuse type (landuse table) and river ID length, road ID and length, Point ID and slope (topographic table).
Two application have already been implemented, namely, the mapping of Pergau reservoir and downstream area and reservoir storage volume computation.
- Maps
Topographic maps at the scale of 1:5000 with contour interval at 1 meter interval for low laying areas and a 5 meter interval for hilly and moderately undulating areas have been generated from the database. A Digital Elevation Model (DEM ) also can be constructed (figure 2) for the purpose of estimating slope gradient, aspect ratio and slope length.
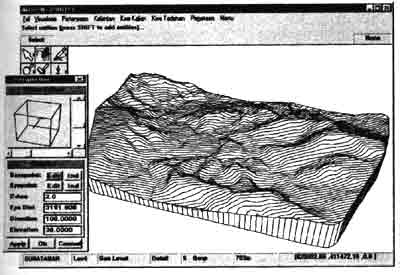
Figure 2. Digital Elevation Model of Pergau Reservoir Area
Landuse map is another form of spatial information which often requested for land management purposes. The study area is still largely covered by tropical rainforest, while rubber trees are found in parts which indicate the predominant activity in this area.
- Volume Computation
Another application that also has been look into is the computation of the reservoir volume. The above information are useful for the study of the reservoir sedimentation. Differences of the volume at the specified supply level (640 m for this case) in the future will give the extent of the sedimentation of the Pergau Reservoir. Therefore, hydrographic surveys should be done at regular intervals, preferably at every six months, to assess the extent of the sedimentation process within the Pergau Reservoir.
| Supply Level (m) | Volume (m3) |
| 585 | 23.441 |
| 590 | 4,844.279 |
| 595 | 357,439.950 |
| 600 | 898.962.262 |
| 605 | 1,929,521.223 |
| 610 | 3,916,809.853 |
| 615 | 8,552,745.282 |
| 620 | 17,095,443.994 |
| 625 | 29,631,655.85 |
| 635 | 51,165,345.157 |
| 636.5 (FSL) | 58,743,283.45 |
| 640 | 77,301,753.260 |
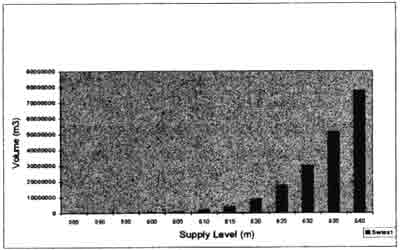
Figure 3. Bar Charts of Supply Level Vs Volume
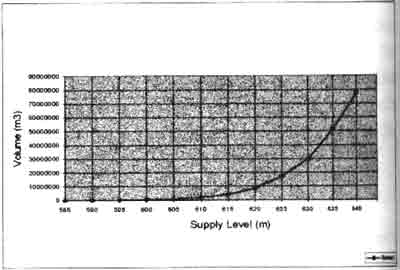
Figure 4. Storage Curve of Pergau Reservoir
Future Research & Conclusion
This on-going research is to be continued with the second of the study, i.e., the development of Pergau Reservoir Information System (PRIS). PRIS will be used to plan, monitor and manage the reservoir using the various analysis of spatial and non-spatial attribute overlaying, simulation and modeling, and integrated analysis of spatial and non-spatial attribute data. With the advent in Remote Sensing satellite data which provide 1-4m resolution, there is also a plan to use this kind of data as one of the data sources for the Pergau Reservoir database. This kind of data, coupled with centimeter level accuracy of GPS data, makes it possible to update the database with accurate, repeatable and useful data.
Acknowledgement
We appreciate the assistance by Tenaga Nasional Berhad (TNB) staffs in the data acquisition process. We also would like to thank our colleagues at the faculty for their helps, advice and support during different stages of the study.
References
- Bishr, Y.A. and Radwan, M.M. (195). Preliminary Design of a Decision Support System for Watershed Menagement, ITC Journal 1995-1.
- Hendersen, F.B. (1996). Can High-Resolution Data Augment A/C/C Efforts?, GIS World, May 1996.
- Hajeela, D. (1989). Horizontal and Vertical Control for Aerial Triangulation for Large Scale Mapping by GPS, Geodetical Info Magazine, June 1989.
- Maijerink, A.M.J. (1990). Summary report n ILWIS Development, ITC Journal 1990-3.
- Mustafa, G. (1987). Reservoir Sedimentation, Post Graduate Course in Sediment Transport Technology, proceeding Vol. 2 Ankara, Turkey.
- Nik, A.R., Yusop, Z and Kasran, B. (1993). Watershed Management: Effects of Selective Logging, Forest Research Institute Malaysia (FRIM), Malaysia.
- Suwanwerakamtorn, R. (1994). GIS and Hydrologic Modeling for the Management of Small Watersheds. ITC Journal 1994-4.