| GISdevelopment.net ---> AARS ---> ACRS 1997 ---> Water Resources |
Correlation of Total
suspended Sediments and Reflectance of Landsat TM in Laguna De Bay,
Philippines
Fay F. Mancebo, Romeo C.
Bruce, Zenaida B. Catalan, Medel P. Lim suan, Ben S. Malayang
III
Institute of Environmental Science and Management,
University of the Philippines
Los Banos, college, Laguna, 4030 Philippines
Tel. (63)-049-5362251; Fax: (63)-049-5364101
E-mail : stm@mudspring.uplb.edu.ph
Abstract Institute of Environmental Science and Management,
University of the Philippines
Los Banos, college, Laguna, 4030 Philippines
Tel. (63)-049-5362251; Fax: (63)-049-5364101
E-mail : stm@mudspring.uplb.edu.ph
This exploratory study attempted to apply the integrationof Remote Sensing (RS) and Geographic Information System (GIS) technologies in monitoring and assessment of the water quality of Laguna de Bay. More specifically, the study determined the correlation between TSS and reflectance of Bands 1,2,3,4,5,7 in Landsat TM utilizing the LLDA and NAMRIA data, taken in February 1992, March and April 1993.
Using the pearson's Correlation Analysis results have been shown that TSS values were significantly corrected to the reflectance of Bands 2 and 3. A reclassified image for TSS with the highest correlation was generated showing four reflectance ranges as indicated by the colors. These findings have shown that the two technologies with some validations could be an alternative tool for monitoring and assessment of the lake.
Introduction
Under pressure from human activities, aquatic ecosystems such as lakes, rivers and coastal areas have undergone profound environmental changes resulting in impairments or loss of the services they provide to humans. In Laguna de Bay, one of the pressures from human activities is the continuous discharge of sediment into it that seems to worsen the turbidity of the lake. This condition appears to be due to the presence of high levels of suspended solids in its waters and at certain times of the year, of phytoplankton population. Turbidity is considered to be one of the major environmental factors limiting the lake's productivity (Nielsen, 1983; Santiago, 1991; Batac-Catalan, 1995).
The technology used for measuring suspended solids is in situ measurement or collection of water samples for successive laboratory analysis. However, the need to provide both spatial and temporal variability becomes imperative for faster monitoring of the lake. The technologies that offer such capabilities are the Remote Sensing and GIS.
Suspended solids in water produce visible changes in the surface of the waters and in the reflected solar radiation. Such changes in the spectral signal from surface water can be captured by the satellite (Ritchie, 1990)
In View of these concerns, this exploratory study was conducted to monitor and assess the water quality of the lake. More specifically, it aimed to determine the correlation between the total suspended solids (TSS) in situ and the reflectance in the Landsat TM of Laguna de Bay utilizing the Laguna Lake Development Authority (LLDA) and National Mapping Resource Information Agency (NAMRIA) data, taken in February 1992, and in march and April 1993, respectively.
Methodology
Locale of Study
The Laguna Lake Basin is situated in Region 4 (Southern Tagalog) at coordinates 14o 11.6'to 14o 32.2' north longitude and 120o 2.7' to 121o 28.7' east latitude. It has a surface area of 90,000 ha. And is considered to be the largest feshwater body in the Philippines and the second largest freshwater lake in Southeast Asia (URSI, 1989). The areas of interest are the sampling points set by LLDA in 1992 and 1993. These are located in the West, south, Central and East Bays (Figure 1).
Collection of Available Secondary Data
The available raw landsat TM digital data (11 Feb 1992 and 2 April 1993) were provided by NAMRIA. The secondary data of TSS close to the Landsat TM dates obtained from LLDA. Other secondary data such as topographic maps with a scale 1:50,000 were obtained from NAMRIA for geometric correction. The climatological data were also taken from the Department of AGRO -Meteorology, UPLB and the Philippine Atmospheric Geophysical Astronomical Services Administration (PAG-ASA). The status of the napindan Hydraulic Control Structure (NHCS) was obtain from the Department of Public Works and Highways (DPWH).
Analysis of Data
Remote Sensing Phase
The geometrically-corrected satellite data stored in an exabyte tape was downloaded to the ERMapper network image processing system for image preprocessing. The pixels in the image wre then located using the longitude and latitude coordinates obtained from the field. When the exact pixel location was determined, the reflectance of bands 1,2,3,4,5 and 7 was shown in the data set text profile menu in the ERMapper.
Finally, Person's correlation analysis was used to determine the relationship of TSS and reflectance of bands. All inferential inferential test of hypothesis wee carried out at the 5% and 1% levels of significance.
Geographic Information system (GIS) Phase
The highest TSS and band reflectance were selected for further processing using ARC/INFO GIS software. The lake boundary, tributaries and fish pens were added into the digitized maps. Landsat TM image was then overlays with the digitized map. Universal Transverse Mercator(UTM) system, to ensure that the satellite image and the digitized map have a common reference point on the earth surface.
Clipping, which separates the land and water features of the lake, was done to avoid mixing of the lake and land pixels. The clipped overlayed image had pixel values ranging from a to 255. Reclassification into four user-defined classes for Band 2 and TSS correlation was used. This process was done by grouping the extreme values (high and low tails) in the normal curve as one group. Followed by computer-generated grouping of pixels in the normal curve area where the highest aggregation of pixels are clustered. The resulting image contains contiguous areas (a connected group of cells ) that have the same value (Aranoff, 1993).
Results And Discussion
The February 1992 period
The correlation coefficients for the linear models showed that the relationship between TSS and the reflection for February 1992 are not significant at 5% level. This therefore leads to the acceptance of the null hypothesis (Table 1).
| Band1 | Band2 | Band3 | Band4 | Band5 | Band7 | |
| TSS 1992 | .03 | -.01 | -.04 | .00 | -.46 | .51 |
| TSS1993 | .88 | .99 | .96* | .89 | .90 | .94 |
The non significant correlation may be due to the environmental conditions (Table 2) during sampling which could have affected the image.
| Landsat TM (date)1 |
Field data
(date)2 |
Surface
Temp.(oC)3 |
Precipitation
(mm)3 |
Influencing wind regimes4 |
NHCS (Status)5 |
| 11Feb92 | 11Feb92 | 26.36 | 4Feb Trace amounts |
Northeasterlies | all
gates closed |
| 02Apr93 | 23Mar93 | 28.15 | 19-22Mar Trace amounts |
Easterlies | all gates opended |
The prevailing meteorological conditions (Table 3) in the PAG-ASA stations dated 11 Feb 1992 show that the maximum wind velocity in the stations were stronger compared to 2 April 1993. Wind forces affect the lake through the formation of waves which then affect reflectance by making the surface of the water rough and may adopt diffuse or lambertian reflectance that causes the energy to be reflected in all directions. This, could hamper the complete capture of the reflected energy by the satellite. Furthermore, the mean cloudiness on 11 Feb 1992 ranged from 1 to 7 octas while on the latter data it was 2 to 3 octas.
The apparent difference between the two images illustrate the operational restrictions on the use of passive remote sensors such as landsat TM due to environmental conditions. However, there are already new technologies and image correction techniques that answer this need. Unfortunately, the cost, availability of data, technical capability and support of the concerned sectors may slow down the acquisition and implementation.
| Landsat TM (date) | PAS-ASA (stations) | Average Wind Velocity (mps) | Maximum Speed (mps) | Mean Cloudiness | Presence of Smoke/haze |
| 11Feb92 | Ambulong | 1 | -nil- | 2 | + |
| Sta.Cruz | -nil- | -nil- | 7 | + | |
| Anso-Naia | 3 | 8 | 1 | + | |
| Science Garden | 1 | 10 | 2 | + | |
| Agromet | -nil- | 9 | 3 | + | |
| 02Apr93 | Ambulong | 1 | -nil- | 3 | + |
| Sta.Cruz | -nil- | -nil- | 2 | + | |
| Anso-Naia | 2 | 3 | 2 | + | |
| Science Garden | 2 | -nil- | 2 | + | |
| Agromet. | -nil- | -nil- | 2 | + | |
| Source: PAG-ASA,; (nil-not in the list); (+) - present; | |||||
The April 1993 period
For the period correlation test revealted that TSS has shown a highly significant correlation with reflectance. These results have led to the rejection of the null hypothesis at 5% level of significance. High correlation coefficients (Table 1) between TSS and Band 2 (0.56-.0.60mm) was noted (r=.99). the same relationship was noted between TSS and Band 3 (0.63-0.69 mm) which is (r=.96).
Several studies in the past have shown similar results in the use especially of Bands 2 and 3. Ritchie (1990) found that the highest correlation between suspended sediment and reflectance wee in Bands 3 and 4. In another study done by lathrop (1991), the simple exponential model that be used ws the Band3/Band1 ratio and it was fund to be a useful index for estimating TSS more of the incoming solr radiation was being reflected and measured by the sensor. the strength of this relationship falls under the region of shorter wavelengths, specifically in the visible region where Bands 1,2,3 belong.
The average reflectance of the pixels of the sampling points as represented by the TSS could be mostly made up of vegetation and soil (Harrison, 1989; ERDAS, 1994). According to Newspaper reports from March 17 up to may 9, 1993, a "fishkill" phenomenon (Bartolome, 1993; Mogato, 1993; Philippine Times Journal, 1993; Magsino, 1993; Nocum, 1993). Which seems to support the idea that algal bloom is one factor that contributes to the reflectance of suspended solids. In addition, the fish pens/cages may also affect reflectance. Since they are made of bamboo or stumps in general, it is probable that the sensor is treating it is totality as vegetation.
Another possible explanation for these results is the concentration of TSS. It has been established by the ADAGWQ (1997), that TSS is comprised of organic and mineral particles that are transported in the water column coming from land erosion, erosion of river channels, and a wide range of industrial and agricultural chemicals. TSS Concentration is also affected by factors such as the actual circulation pattern of the lake and the possible influence of the opening and closing of NHCS.
Analysis of the Generated TSS Reclassified Satellite Image (Band2)
Figure 1 shwos the predominance of white region which represents extreme reflectance values (30-40; 50+). It covers 13 or 11,869 ha of the lake. The presence of water-based vegetation like hyacinth, ricefields, muddy areas and other water components comprise these areas. The blue region has a high reflectance range of 47-50, which cover 18% or 16,000 ha of the lake is heavily concentrated with suspended solids. Red zones have Band 2 reflectance range of 41-45, covers 51% or 45,662 ha of the lake. The concentration of suspended solids in these areas is quite low. Green area in represent Band 2 reflectance of 46, cover 18% or 16,417 ha of the lake (Table 4).
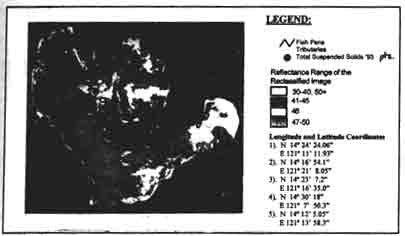
Figure 1. Landsat TM - Band 2, April 2, 1993.
Reclassified image of TSS with Overlays Geographic Coordinates.
| Reflectance | Color | Pixel Count (pc) | % | Area in ha (pc*.09) |
| 30-40, 50+ | white | 131,868 | 13 | 11,869 |
| 41-45 | red | 507,361 | 51 | 45,662 |
| 46 | green | 182,413 | 18 | 16,417 |
| 47-50 | blue | 172831 | 18 | 15,555 |
| Total | 994,473 | 100 | 89,503 |
Based on the above results, the blue areas which signify heavy concentration of suspended solids are predominant in the West Bay where built-up areas and major tributaries are located. There seems to be a strong positive relationship between the location of built-up areas and tributaries and the concentration of total suspended solids. Concerned government agencies should into consideration the effect of industrial and domestic wastes on the lake. In spite of the high TSS concentration, fish pens/cages abound the area. Government should investigate whether the fish products are still safe for human consumption and should intensify and prioritize the monitoring in the West Bay.
Coclusion
The study which has demonstrated a significant relationship between the TSS and the reflectance of the Landsat TM digital data. This could serve as a cost effective guide for resource managers in monitoring the TSS in the lake using bands 2 and 3 in the visible spectrum.
Furthermore, the use of integrated RS/GIS technologies which have been validated through the displayed macro-perspectives of the lake as indicated by the colors, could be and alternative tool to use in addition to the existing in situ measurement.
Literature Cited
- Annotated Digital Atlas of Global Water Quality (ADAGWQ). 1997.
- ARANOFF, S. 1993. Geographic Information systems: a Management Perspective. Canada: WDL Publications, 294p.
- BATAC-CATALAN, Z.B. and M.N. DELENDO. 1995. Impacts of Introductions of Exotic Fish on Inland Fisheries of Laguna de Bay, Philippines. A paper presented at the 15th symposium on lake, reservoir and watershed management. North American Lake's management Society held in Toronto, Canada.
- ERDAS FIELD GUIDS. 1994. Third ed. Georgia: ERDAS Inc. 628 p.
- HARRISION, B.A. and D.L.B. JUPP. 1989. Introduction to Remotely Sensed data. Australia: CSIRO Publications. 141 p.
- LATHROP, R.G., T.M. LILLESAND and B.S. YANDELL. 1991. Testing the Utility of Simple Multi-Date Thematic Mapper Calibration Algorithms for Monitoring Turbid Inland Water. Int. J. Remote Sensing. 12:2045-2063.
- MAGSINO, F. 1993. "Presidential Concern for a Dying Lake." In: Manila Times, May 3, 1993.
- MOGATO, M. 1993. "4 South Tagalog Fishing Areas in State of Calamity." IN: Manila Chronicle, March 30,1993.
- MOLENAAR, M. 1993. "Terrain Objects, their Dynamics and their Monitoring by the Integrationof GIS and Remote Sensing." In : Remote Sensing and Geographical Information Processing, Concepts and Applications for Land Use Monitoring and Agriculture. Ed. By Martien Molenaar. Pp. 1-6.
- NIELSEN, BH.H. 1983. Limnological Studies in Laguna de Bay. Terminal Report to SEAFDEC, Binangonan Freshwater Research Station, Rizal. 58.p.
- NOVO, E.M.M., J.D. Hanson AND p.j. curran. 1989. The Effect of Sediment Type on the Relationship Between Reflectance and Suspended Sediment Concentration. International Journal Remote Remote Sensing. 10(7):1283-1289.
- RITCHIE, J.C. and C.M. COOPER and 1987. Comparison of Landsat MSS Pixel Array Sizes for Estimating Water Quality. Photogrammetry Engineering remote Sensing 53:1549-1553.
- J.C. C.M. COOPER and F.R. SCHIEBE. 1990. The Relationship of MSS and TM Digital Data with Suspended Sediments Chlorophyll, and Temperature in Moon Lake, Mississippi. Remote Sensing Environment. 33:137-145.
- SANTIAGO, A.E. 1991. Turbidity and Seawater Instrusion in Laguna de Bay. Environmental Monitoring and Assessemnt 16:85-95. Netherlands:Kluwer Academic Publishers.
- SLY. P.G. 1993. Laguna Lake Basin, Philippines: Problems and Opportunities. Environemtn and Resource management Project (ERMP) Philippines No. 7. Philippines: ERMP. 338 p.
- URS INTERNATIONAL INC. 1989. Laguna de Bay Toxic and Hazardous Waste Management Feasibility Study. Report for Laguna Lake Development Authority, manila. Vol. 3.
- VERBYLA, D.L. 1995. Satellite Remote Sensing of Natural Resources. New York Lewis Publishers. 197. 197 p.
- VERDIN, J.P. 1983. Corrected vs. Uncorrected landsat-4 MSS Data. Landsat Data Users Notes. 27:4-8.
- NO AUTHOR, 1993. "Laguna de Bay Water Improves in Quality ." In: Philippine Daily Inquirer, April 30, 1997. p-30.
- NO AUTHOR, 1993, "Measures to Save laguna lake Sought." In Philippine Times Journal, May 3, 1993. p. 16.