| GISdevelopment.net ---> AARS ---> ACRS 1997 ---> Water Resources |
Subwatershed Prioritization
for Watershed Management using Remote Sensing and GIS
Bhuwneshwar Prasad. Sah
Kiyoshi Honda & Shunji Murai
Star/Serd, Asian Institute of Technology,
P.O. Box 4, Klong Luang, Pathumthani 12120, Thailand,
Tel. : +66-2-524-6148, Fax.: +66-2-524-6147
E-mail : sah@aith.ac.th, Honda@ait.ac.th, murai@ait.ach.th
Abstract Star/Serd, Asian Institute of Technology,
P.O. Box 4, Klong Luang, Pathumthani 12120, Thailand,
Tel. : +66-2-524-6148, Fax.: +66-2-524-6147
E-mail : sah@aith.ac.th, Honda@ait.ac.th, murai@ait.ach.th
Watershed degradation is the global problem, which is more serious in developing countries like Nepal. As Nepal is mountainous country, a large number of watersheds can be delineated with different aerial coverage and most of them are in degraded condition. While considering the watershed conservation work, it is not feasible to take whole area at once. This calls to divide the watershed in small units, that is subwatershed, by considering its drainage system. As the condition of subwatersheds may not similar, they can be prioritized for conservation work. In this study, subwatersheds of of Trijuga river watershed in eastern Nepal were prioritized by considering their degradation condition and land sensitivity. Here land sensitivity is defined as the locational relationship between forest loss and soil loss. Universal soil Loss Equation in conjunction with Remote Sensing and GIS had been utilized for estimating soil loss and land cover change. Two time series data, that area aerial photographs of year 1978 and Landsat TM data, that of year 1991, were used to make the analysis of soil loss and land cover change. The rate of forest degradation of the study area was 0.57 per cent per year, which is too high while considering the sustainability, along with 0.42 mm/yr increment in soil erosion rate between 1978 to 1991. The new concept of conservation prioritization has been proposed by considering subwatershed degradation speed, sensitivity index and present rate of soil erosion. Based on conservation prioritization, subwatershed conservation activities proposed.
1.Introduction
watershed deterioration is the commen phenomena in most parts of the word . among several causes for this , improper and unwise utilization of watershed resources without any conservation work is the prime one which on which is more severe in developing countries (FAO, 1985). The watersheds of Nepal are good example of such deterioration (DSCWM, 1983). The deterioration occurs generally in terms of forest loss and land degradation by soil erosion. Among several factors, the major one is deforestation followed by unsuitable agricultural practices. Therefore, it is necessary to develop a sustainable land management system that does not cause the degradation of such valuable resources. This is especially important in a predominantly mountainour country like Nepal (Thapa & Weber, 1990). For this, effective monitoring of land cover/land cover change is the basic and essential step. Further analysis, like land degradation, subwatershed prioritization etc., has to be done so that protective measures can be better planned and implemented.
Remote sensing (RS) is very useful in assessing the land cover of an area at a particular time and monitoring the change over a given period (Lillesand & Kiefer, 1987). Furthermore, the land cover/land cover being spatial in nature, Geographic Information System (GIS) can be employed as a powerful tool in such monitoring. Besides, with the creation of digital terrain model, it is possible to make digital representation of the topography of the area, which is very useful in making soil erosion and other analysis (Burrough, 1986; Aronoff, 1991). Under this context, the present study was carried out with the following objectives:
- To estimating the forest and soil loss of the watershed,
- To prioritize the subwatershed based on its present condition, extent of degradation and sensitivity and
- To recommend the subwatershed conservation activities.
Geopraphically the study area lies between 26o 42' and 26o 59' N latitude and 86o 33' 46" and 86o 59' 48" E longitude in the Eastern Region of Nepal (Map 1). There are several river and rivulets in the watershed, which drain in the main river, called as Trijuga River. The name of watershed, that is Trijuga watershed, is derived form this river. Total area of the watershed is 732 sq. km and altitude varies from 75 m to 1942 m. The tropical climate of the low-lying valley gradually passes into the sub-tropical towards higher elevation; north. The average annual temperature 20oC (WEC, 1942) with 1942 mm rainfall. More than 70 percent rainfall is concentrated from May to October. The forest cover is nearly 58 percent which is dominated by tropical Sal (shorea robusta) forest, followed by 24 percent area of agriculture. Agriculture along with livestock is the important source of income and livelihood of the people.
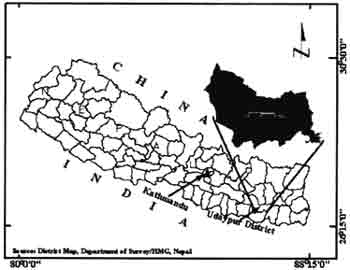
Map 1. Location Map of the Trijuga Watershed, Nepal
3 Methodology
An integrated approach of digital image processing of satellite data and visual interpretation of aerial photograph combined with GIS and USLE was carried out for land cover change and soil loss estimation.
3.1. Collection of Data
- Physiographic survey: 35 soil samples were taken for soil texture and permeability analysis.
- Satellite data: Landsat TM of path/row 140/041, acquired 21 Dec. 1991.
- Aerial photograph: Scale 1:50,000, Nov., 1978
- Reconnaissance maps: 1:50,000, 1982, Land System map: 1:50,000, 1984, and Political map: 1:250,000, 1987.
By using these data, the general methodology was followed as presented in Fig. 1 Land cover map of 1978 was obtained by using visual interpretation of aerial photograph with the help of land use map of 1982, while supervised digital image processing was adopted for 1991 satellite data. After comparison of land cover of 1978 and 1991, the forest loss had been obtained.
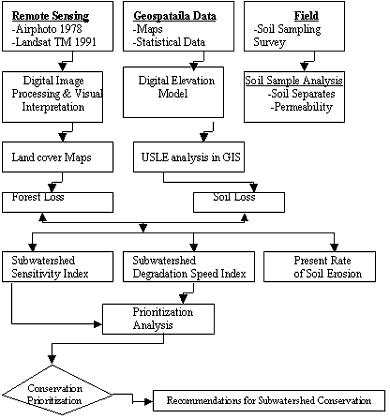
Fig. 1: General Methodology
Widely adopted USLE model was taken to estimate the soil loss (Schwab et. al, 1993). The equation is written as
Where,
E= Mean annual soil loss (tons/ha/yr.),
R = Rainfall erosivity index,
K = Soil erodibility,
L = Slope length,
S = Slope steepness,
C= Crop management and vegetation cover,
P = Erosion control practice factor.
From the average annual rainfall (1942-mm) and the maximum 30-munute intensity (100-mm) of the year 1991, the R-value was calculated (Foster, 1988 and
Morgan, 1986. the K Factor for 20 soil units and the P factor for different land cover were determined by using Schawab et al. (1993). The slope length for different land cover were adopted from the DSCWM/HMG, Nepal 1992, while the slope inclination factor was determined by using the digital Terrain Model (DTM) which was interpolated
After digitizing the 20 meter contour interval lines. The C value was adopted from Wischmeier and Smit (1978) for forest, shrubs and grazing lands, while for agriculture land, it was calculated as suggested by Morgan, (1986). The Soil samples were analyzed for fexture for texture and permeability at RARS, Tarahara, Sunsari, Nepal. The layers of USLE model were created and integrated with the help of GIS (Fig. 2).
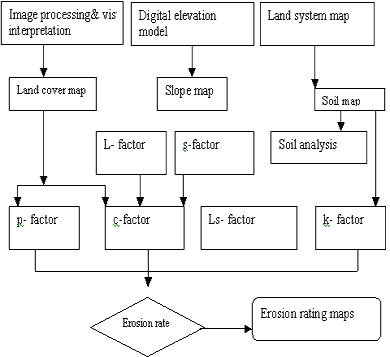
Fig. 2: USLE Model in Conjunction with RS & GIS to Estimate Soil Erosion
4. Result and Discussion
4.1 Overall Situation
Overall land cover change and soil loss increment for the duration of 13 years; between 1978 and 1991 are given in Table 1. the rate for forest loss of the study area was 0.57 per cent per year and is too high for sustainable use of resources (Sah et al, 1997). The increment of the soil erosion rate from 0.95 to 1.37 mm/yr is significant for 13 years of time interval as the tolerance level of soil erosion in Nepal is in the range of 0.5 mm/yr (Sharma, 1981)
| Land Cover Types | Land Cover (%) | Soil Loss (mm/yr) | ||||
| 1978 | 1991 | Change | 1978 | 1991 | 4.33 | |
| Shrubs | 2.27 | 3.45 | 1.18 | 9.40 | 13.73 | 4.33 |
| Degreded forest | 4.19 | 8.90 | 4.71 | 0.84 | 0.80 | -0.04 |
| Forest | 65.21 | 57.86 | -7.35 | 0.13 | 0.14 | 0.01 |
| Agriculture | 22.49 | 23.66 | 1.17 | 2.74 | 3.14 | 0.40 |
| River | 5.84 | 6.14 | 0.30 | 0.00 | 0.00 | 0.00 |
| Total | 100.0 | 100.0 | 0.00 | 0.95 | 1.37 | 0.42 |
| Degreded forest <40% canopy cover, forest=>40% canopy cover Forest Loss Rate=7.35/13=0.57 percent per year | ||||||
4.2 Delineation of Subwatershed:
From the topographic map, twenty-two subwatersheds were delineated and after the main river of that subwatshed (Map 2). The forest cover of the subwatershed and the soil loss status were taken as the basis for their prioritization. Furthermore, the contribution form each subwatershed to the total amount of soil loss from whole watershed area was also considered for such evaluation. Table 2 shows the name list of delineated subwatershed along with their forest and soil loss status.
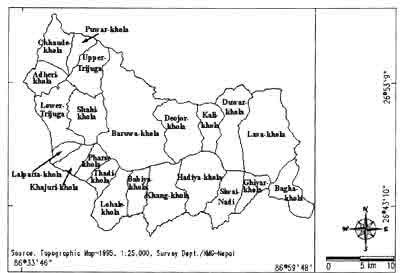
Map 2: Subwatershed Map of the Trijuga Watershed, Nepal
| Catchments Name | Area(sq. km) | Area of Forest (%) | Ave soil Loss(t/ha/yr) | %Contribution to soil Loss | DSI | SI | ||||||
| 1978 | 1991 | Change | 1978 | 1991(PC) | Change | 1978 | 1991 | Change | ||||
| Adheri-Khola | 20.27 | 90.73 | 76.35 | 14.37 | 5.57 | 13.12 | 7.54 | 1.24 | 2.02 | 0.78 | 7.90 | 0.52 |
| Babiya-Khola | 18.58 | 73.54 | 70.75 | 2.79 | 3.22 | 3.68 | 0.46 | 0.66 | 0.52 | -0.14 | 1.01 | 0.16 |
| Bagha-Khola | 26.37 | 20.06 | 20.02 | 0.04 | 6.06 | 6.53 | 0.48 | 1.75 | 1.31 | -0.44 | 0.12 | 12.08 |
| Baruwa-Khola | 121.35 | 65.75 | 60.08 | 5.67 | 20.44 | 29.69 | 9.25 | 27.15 | 27.37 | 0.22 | 5.92 | 1.63 |
| Chhaude-Khola | 25.46 | 30.63 | 29.46 | 1.17 | 60.62 | 83.14 | 22.52 | 16.90 | 16.08 | -0.82 | 10.28 | 19.22 |
| Deojor-Khola | 45.74 | 90.16 | 84.26 | 5.91 | 4.41 | 5.09 | 0.68 | 2.21 | 1.77 | -0.44 | 1.97 | 0.11 |
| Duwar-Khola | 44.59 | 52.38 | 45.95 | 6.44 | 13.96 | 26.75 | 12.78 | 6.82 | 9.06 | 2.25 | 8.25 | 1.99 |
| Ghiyar-Khola | 14.73 | 71.88 | 64.49 | 7.40 | 3.94 | 4.79 | 0.85 | 0.64 | 0.54 | -0.10 | 2.58 | 0.11 |
| Hadiya-Khola | 46.15 | 68.62 | 53.12 | 15.50 | 3.36 | 4.94 | 1.58 | 1.70 | 1.73 | 0.03 | 5.37 | 0.10 |
| Kali-Khola | 20.91 | 90.59 | 85.61 | 4.98 | 4.45 | 5.80 | 1.35 | 1.02 | 0.92 | -0.10 | 2.07 | 0.27 |
| Khajuri-Khola | 12.37 | 59.93 | 38.47 | 21.46 | 4.91 | 6.51 | 1.59 | 0.67 | 0.61 | -0.05 | 7.14 | 0.07 |
| Khang-Khola | 46.15 | 77.05 | 75.29 | 1.76 | 2.28 | 2.83 | 0.56 | 1.16 | 1.00 | -0.16 | 0.74 | 0.32 |
| Lalpatta-Khola | 7.55 | 71.54 | 33.19 | 38.35 | 3.63 | 7.54 | 3.91 | 0.30 | 0.43 | 0.13 | 13.30 | 0.10 |
| Lava-Khola | 82.47 | 51.59 | 36.85 | 14.99 | 6.03 | 11.22 | 5.19 | 5.44 | 7.03 | 1.59 | 7.23 | 0.35 |
| Lohale-Khola | 31.50 | 89.26 | 86.85 | 2.41 | 1.33 | 1.41 | 0.09 | 0.46 | 0.34 | -0.12 | 0.73 | 0.04 |
| Lower-Trijuga | 36.94 | 70.05 | 58.83 | 11.21 | 8.63 | 12.45 | 3.81 | 3.49 | 3.49 | 0.00 | 5.08 | 0.34 |
| Pharse-Khola | 12.71 | 46.58 | 22.97 | 23.61 | 5.89 | 8.58 | 2.70 | 0.82 | 0.83 | 0.01 | 8.30 | 0.11 |
| Puwar-Khola | 12.04 | 55.37 | 47.71 | 7.67 | 62.06 | 76.13 | 14.07 | 8.17 | 6.96 | -1.21 | 8.33 | 1.84 |
| Shahi-Khola | 35.02 | 64.77 | 48.08 | 16.69 | 10.35 | 16.43 | 6.08 | 3.97 | 4.37 | 0.40 | 7.84 | 0.36 |
| Siwai-Nadi | 27.78 | 78.14 | 73.38 | 4.76 | 2.47 | 2.96 | 0.48 | 0.75 | 0.62 | -0.13 | 1.61 | 0.10 |
| Thadi-Khola | 13.31 | 73.59 | 58.43 | 15.16 | 2.98 | 4.29 | 1.31 | 0.43 | 0.43 | 0.00 | 5.14 | 0.09 |
| Upper-Trijuga | 29.72 | 48.58 | 47.99 | 0.58 | 43.88 | 55.60 | 11.72 | 14.27 | 12.56 | -1.72 | 5.02 | 20.05 |
4.3 Defining the Parameters and Formulating Indices (Condition Indicator)
4.3.1 Degradation Speed Index (DSI)
The soil and forest and main resources of the watershed. Their amount of change in specified period of time is the indication of the status changing speed. So by assessing the forest and soil loss change between 1978 and 1991 and contribution to the total soil loss form each subwatershed. DSI has been formulated (Sah et al, 1997). The DSI is defined as the degradation speed of the subwatersheds.
The weight of individual factor has been decided on the basis of their importance to the land degradation. The location DIS value is given in Table 2.
4.3.2 Sensitivity Analysis and Sensitivity Index (SI)
Impact of forest loss subwatersheds causes various level responses, which is soil loss increase in this case. It depends on the characteristics such as steepness of subwatersheds of way of cutting tree. For example forest loss in steep slope is more critical than in flat area. To assess this characteristic, land sensitivity had been proposed and SI is defined (Sah et al, 1997). The land sensitivity analysis (Fig. 3) shows that some subwatersheds are more sensitive as slight loss of forest produced tremendous amount of soil. The SI for subwatershed is given in Table 2.
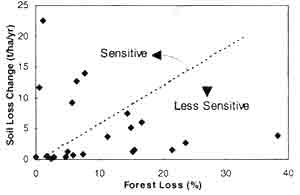
Fig. 2: USLE Model in Conjunction with RS & GIS to Estimate Soil Erosion
4.3.3. Present Condition (PC):
The soil erosion rate of the 1991 is considered as PC of the subwatersheds. Among several indicators, the higher rate of soil erosion can be considered as on indicator of the conditions of the subwatershed (Table 2).
4.4. Prioritization Analysis
As discussed earlier, the DSI, SI and PC were taken as the condition and used for the prioritization analysis by simple matrix method. To create this matrix, the range of quantitative value has been defined for qualitative value. Table 3 shows the qualitative for DSI, SI and PC.
| Rating | DSI | SI | PC |
| Very Low | <1 | - | - |
| Low | 1 to 4 | <0.1 | <7 |
| Medium | 4 to 6 | 0.1 to 0.5 | 7 to 15 |
| High | 6 to 8 | 0.5 to 2 | 15 to 30 |
| Very High | >8 | >2 | >30 |
From the qualitative rating, the two-dimensional overlay matrix has been created by taking two indicators at a time. First the matrix analysis between DSI and SI had been done and they were grouped into 5 classes, which were used for second matrix analysis with PC. Lastly they were again grouped into five qualitative classes (Table 4). The group has been decided on the basis of the logical combination of the indicators. For example, the combination of high DSI and SI were grouped as first priority group. The output of the matrix analysis is given in Table 5, where all twenty-two subwatershed were classified in five group. Map 3 shows the spatial distribution of the subwatershed for conservation prioritization work.
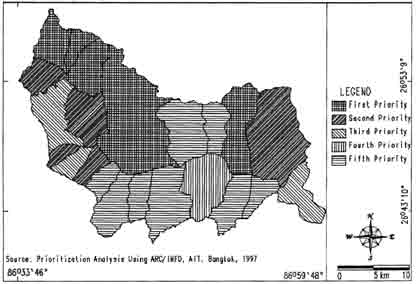
Map 3: Conservation Prioritization Map of the Trijuga Watershed, Nepal
| SI/DSI | VL | L | M | H | VH | PC/DSI-SI | VL | L | M | H | VH | |
| L | 5 | 5 | 4 | 3 | 2 | L | 5 | 5 | 4 | 3 | 2 | |
| M | 5 | 4 | 3 | 2 | 2 | M | 5 | 4 | 3 | 2 | 2 | |
| H | 4 | 3 | 2 | 1 | 1 | H | 4 | 3 | 2 | 1 | 1 | |
| VH | 3 | 2 | 1 | 1 | 1 | VH | 3 | 2 | 1 | 1 | 1 | |
| VL= Very Low, L=Low,
M=Medium, =High, VH=Very high 12,3,4 and 5 are the Priority Decreasing order | ||||||||||||
| Conservation Prioritization | List of the subwathershed |
| Fist Priority | Chhaude-khola, Puwar-khola, Upper-Trijuga, Baruwa-Khola and Duwar-khola |
| Second Priority | Adheri-khola, Lava-khola, shahi-khola, Lalpatta-khola and Pharse-khola |
| Third Priority | Lower-Trijuga, Khajuri-khola and Bagha-khola |
| Fourty Priority | Hadiya-Khola |
| Fifth Priority | Deojor-khola, Kali-khola, thadi-khola, Khang-khola, Babiya-khola, Lohale-khola, Siwai-Naid and Ghiyar -khola |
5 Recommendations
Conservation work in the Trijuga watershed area should be started according to the priority list of Table 5. Slope stabilization, slope failure protection, gully control by check dam, reforestation, growing of horticultural crop along with some other intensive soil conservation activities are required for the first ranking subwatersheds. Fifth ranking subwatershed need little attention like maintaining the crown cover and protection of the existing forest along with managed agriculture. Other subwatersheds should be treated by intermediate activities according to their ranks.
6 Conclusion
Delineating the wathershed area into subwatershed for priority based conservation work is essential and appropriate for the developing countries like Nepal. Considering its drainage system can do such delineation. The delineated subwatersheds were used for prioritization. Prioritization can be done by considering their forest loss, soil loss and land sensitivity, which is defined as the locational relationship between forest loss and soil loss. These factors were used to extract the DSI, SI and PC, which were considered as the condition indicator of the subwatershed. Using these condition indicators, a new method of prioritization for conservation work was proposed by the qualitative matrix analysis. Based on prioritization, subwatershed conservation management activities were proposed. Finally, it can be said that remote sensing and GIS in combination with USLE model can be used as appropriate tools for subwathershed prioritization.
Reference
- Aronoff, S. (1991), geographic Information systems: A Management Perspective, WDL Publications, Ottawa.
- Burrough, PA.(1986), Principles of Geographic Information Systems for land Resources Assessment, Clarendon Press, Oxford.
- DSCWM/HMG, Nepal (1992), Soil Conservation and Waterhsed management Operation Plan for Subwatershed of Palpa District, DSCWM/HMG, Nepal.
- DSCWM (1983), Watershed Conditions of the districts of Nepal, Department of soil conservation and Watershed management, Kathmandu.
- FAO (1985), Tropical Forestry Action Plan, Committee on Forest Development in the Tropics, FAO, UN, Rome.
- Foster, G.R. (1988), modeling soil Erosion and Sediment Yield, In soil Erosion Research Methods, Editied by R. Lal ISSS, The netherland.
- Lillesand, T.M. & Kiefer, R.W. (1987), Remote Sensing and Image Interpretation, John Wiley and Sons, New York.
- Morgan, R.P.C. (1986), soil erosion and Conservation, Longman group UK Ltd., London.
- Remote Sensing and GIS for Watershed Management, Asian-Pacific Remote Sensing Journal, Vol. 9, No. 2
- Schawab, G.O., Fangmeier, D.D., Elliot, W.J. and R.K. Frevert (1993), Soil and Water conservation Engineering, 4th Edition, John wiley & Sons, Inc., NY.
- Sharma, CK.(1981), Landslide and soil erosion in Nepal. 2nd Edition, Navana Printing Works Private Ltd., Calcutta.
- Thapa, G.B. & K.E. Weber (1990), Managing Mountain Watersheds: The Upper Pokhara Valley, Nepal, HSD Monograph 22, AIT, Bangkok.
- WEC (1982), Hydorlogical Studies of Nepal, Vol. I& II, WEC, Water and Energy Commission, Ministry of Water Resource, HMG, Nepal.
- Wischmeier, W.H. and D.D. Smith (1978), Predicting Rainfall Erosion Losses A Guide to Conservation Planning, USDA Handbook 537, Washington.