| GISdevelopment.net ---> AARS ---> ACRS 1997 ---> Poster Session 3 |
Use of ERS-1 SAR Data for
Some Marine Applcations in Malaysia
Mohd Ibrahim Sensi Mohd,
Samsudin Ahmad & Khor Soong Wei
Centre For Remote Sensing,
Faculty of Geoinformation Science and Engineering
Univerisiti Teknologi Malaysia,
Locked Bag 791, 80990 Johor Bahru, Malaysia
Tel : (07)-5502880 Fax : (6 07) 5566163
E-mail : mism@fksg.utm.my
Abstract Centre For Remote Sensing,
Faculty of Geoinformation Science and Engineering
Univerisiti Teknologi Malaysia,
Locked Bag 791, 80990 Johor Bahru, Malaysia
Tel : (07)-5502880 Fax : (6 07) 5566163
E-mail : mism@fksg.utm.my
Radar remoter sensing has good potentials for application in areas that are prone to cloud cover especially in the tropics. Multi-temporal ERS-1 Synthetic Aperture Radar (SAR) data provide a useful tool for studying the ever-changing conditions and phenomenon in the sea. This paper reports on the results of a study that has been carried out under the EC-ASEAN ERS-1 project to derive some information in the marine environment from the ERS-1 SAR data. In the study, the data were processed to obtain ocean wave spectra in order to derive information about ocean wavelength and direction using the 2-D Fast Fourier Transform. A radar bathymetry model was also used to assess a number of maritime features potentially caused by topography of the sea bottom. The contrast profile produced by the model were compared to profile extracted from the ERS-1 images. Digital image processing was also carried out by using the PCI EASI/PACE and Ergo Vista software for visual interpretations of oil slicks, ship locations, ship wakes and some coastal features such as river outflow and fronts. The results of the study show that ERS-1 SAR data has great potential for applications in the Malaysia coastal zone.
Introduction
For applications in the marine environment, multitemporal ERS-1 SAR data provide a useful tools for studying the ever-changing conditions and phenomenon in the area. For radar bands in Spaceborne SAR systems the microwave radiation is not affected by the atmosphere and does not penetrate into the water. Therefore, all signature on SAR images are due to variations in the radar backscatter intensity from the water surface. Two test areas were selected, one area stretches from Kuala Terengganu to Dungun on the north-east coast of Peninsular Malaysia, and one near Kuala Baram on the north-west coast of Sarawak (Figure 1). Both areas are characterized by large outflowing river and are affected by coastal erosion and accretion during the monsoon season. In this paper, some of the results obtained in the MAL-2 EC-ASEAN ERS-1 Radar Remote Sensing Project are reported.
Bathymetry Signature Model
In the study, the radar bathymetry model implemented at TNO was used to assess a number of maritime features in the image potentially caused by topography of the sea bottom. This model is based on the action balance equation, weak hydrodynamic interaction theory and Bragg scattering (Vogelzang, 1989). The model which is suitable for shallow waters was run using estimated bathymetric profiles based on available hydrographic charts, wind, current velocities and directions at the time of ERS-1 imaging. The contrast profiles produced by the model were compared to profiles extracted from the ERS-1 images. The results are shown in figure 2(a), 2(b) and 2(c).
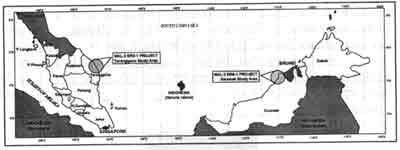
Figure 1: Map of the MAL-2 study area.
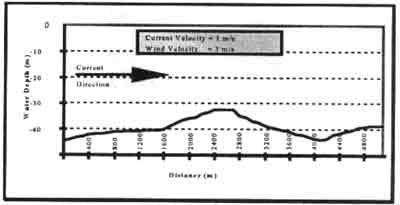
Figure 2(a) : Sea bottom profile and marine information in the study area.
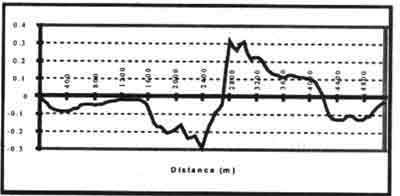
Figure 2 (b) : Radar contrast derived from the model.
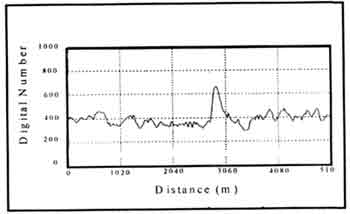
Figure 2 (c ) : Profile from ERS-1 data.
Ocean Wave Spectra
ERS-1 data has been demonstrated to provide ocean wave information in terms of wavelengths and directions. Ergo Vista software was used to calculate wave spectra from PRI images. Single SAR images frames comprising of 512 x 512 image pixels was extracted. Since each pixels represents a 12.5 m x 12.5 m area, the entire image frame corresponds to a 6.4 km x 6.4 km path on the ocean surface. The frame size provides a sufficiently large area that at least 10 cycles of very long surface waves, up to 640 m in length, can be included in a single image frame. They are also small enough that the ocean can be reasonably assumed homogeneous within a frame (Monaldo, 1991). The wave spectra were calculated based on a 2-dimensional Fast Fourier Transform, and the results are as shown in figure 3. This process was repeated for other frames in the image.
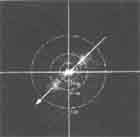
Figure 3: Wave spectra derived from single frame of ERS-1 data acquired on 5 Mar 93. Circle and arrow represent ocean wavelength and direction respectively.
Visual Image Interpretation
ERS-1 images also used to detect oil slick, ship and ship wakes and water fronts. Figure 4(a) illustrates the presence of oil slicks/spills which appear as dark thin lines in the image for both study areas. Figure 4(b) shows the variation of the dB along the azimuth direction around the slicked area. The backscatter from the slick area is about 10 dB lower than the surrounding areas. Figure 5 illustrates the use of ERS-1 data for locating ship traffic in the Kuala Terengganu study area. Figure 6 shows the presence of ocean eddies caused by natural-occurring surface slick patterns (Gower, 1994). Figure 7 illustrates the possible presence of an oceanic phenomena, a lone internal wave, in the Kuala Terengganu study area. Figure 8 shows a water front in the Kuala Terengganu study area due to the meeting of two water masses, one from the sea and one from the river. Figure 9 illustrates a storm-like echo in the South China Sea near the Kuala Terengganu study area seen by ERS-1 SAR.
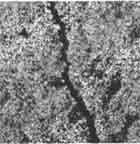
Figure 4(a) : Oil slicks on ERS-1 Frost filtered image of 12 October 1993 in Sarawak study area.
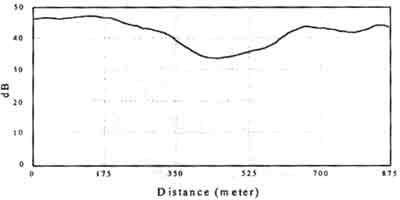
Figure 4(b) : Variation of the Averaged Backscattered Power along the Azimuth Direction around the slick area (difference about 10 dB).
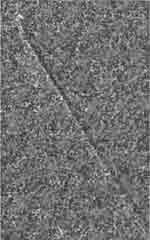
Figure 5 : Ship traffic and ship wake in the Terengganu study area
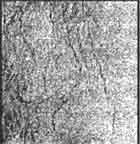
Figure 6: Water eddies formed by natural occurring surfactants on ERS-1 SAR image of 2 September 1993 in Terengganu study area.
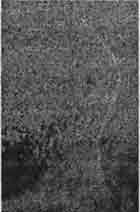
Figure 7: Lone internal wave on ERS-1 SAR image of 12 September 1993 in Terengganu study area.
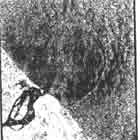
Figure 8: Water front on ERS-1 SaR image of 12 September 1993 In Terengganu study area.
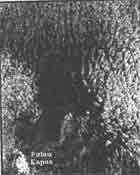
Figure 9: Strong footprint on ERS-1 SAR image of 12 September 1993 in Terengganu study area.
Results & Discussions
The radar contrast derived from the bathymetric signature model was quite consistent with the shape of the sea bottom profile obtained form the hydrographic. The results obtained from ERS-1 data also compare well with the above results (Figure 2(a), 2(b) and (2c)). From the ocean wave spectra analysis, the wavelength and direction of the ocean waves have been determined from the images (Figure 3). The dominant wavelength is about 200 m. The spectra show a 180° ambiguity as the wave propagation direction is not resolved. From the visual interpretation of the processed images, it was possible to locate oil slick areas which appear as dark patches because of the damping of the ocean wave due to the oil layer which reduces the radar backscatter (Figure 4(a) and 4(b)). Ship and ship wakes have also been identified on the image with the wakes trailing for several kilometers behind the ship (Figure 5). Moesoscale oceanic phenomenon such as ocean eddies produced by natural-occurring surfactants (Figure 6) as well as a lone internal wave (Figure 7) become readily visible on the ERS-1 SAR images. Water fronts where water from the river meet with the sea water is also clearly visible in the images (Figure 8). A storm footprint was also detected in the Kuala Terengganu study area (Figure 9).
Conclusions
From the work that has been carried out in this study, the ERS-1 SAR data has shown great potential in deriving information for some marine applications in Malaysian waters. Although the results of he study are encouraging, further studies need to be done to improve the results in order to operationalize the use of ERS-1 SAR data . However, in order to achieve this, suitable mechanisms should be made available in order to obtain timely data especially in sea areas which are dynamic in nature.
Acknowledgements
The authors wish to thank the EC/ESA for funding and supplying of ERS-1 SAR data. Thanks are also due to Dr. H. Greidanus of TNO, the Netherlands for his technical advice and for the use of the bathymetry model. The contributions from the co-investigators, Dr. Mohamed Said Mat Lela (UTM) and Mr. Henry Litong Among (Geological Survey Sarawak) are duely acknowledged.
References
- Gower, J. F. L., 1994, Mapping Coastal Currents with SAR, Using Naturally-Occurring Surface Slick Patterns. Int. Geoscience and Remote Sensing Symposium 94 Home Page (igarss@starhawk.jpl.nasa.gov), Paper 940422.
- Monaldo. F. M., 1991, The Consequences of Sampling Variability on Estimation of Wave Number and Propagation Direction from Spaceborne SAR Image Spectra. IEEE Transactions on Geoscience and Remote Sensing, Vol. 29, No. 1, pp. 113-119.
- Vogelzang, J., 1989, The Mapping of Bottom Topography with Imaging Radar : A Comparison of the Hydrodynamic Modulation in some Existing Models . Int. J. Remote Sensing, Vol. 10, No. 9, pp. 150.-1518.