| GISdevelopment.net ---> AARS ---> ACRS 1997 ---> Poster Session 3 |
Radar Backscattering of
Vegetation from ERS-1 SAR Data and a Radiative Canopy Model
Lau Yok King, Mohd. Ibrahim
Seeni Mohd. And Samudin Ahmad
Centre for Remote Sensing,
Faculty of Geoinformation Science and Engineering
Universit Teknologi Malaysia,
Locked Bag 791, 80990 Johor Bahru, Malaysia
Phone : +(6 07) 550 2880 Fax : +(6 07) 556 6163
E-mail : mism@fksg.utm.my
Abstract Centre for Remote Sensing,
Faculty of Geoinformation Science and Engineering
Universit Teknologi Malaysia,
Locked Bag 791, 80990 Johor Bahru, Malaysia
Phone : +(6 07) 550 2880 Fax : +(6 07) 556 6163
E-mail : mism@fksg.utm.my
Satellite remote sensing using the visible and the infrared wavelengths has been used successfully in various applications related to earth resource studies and monitoring of the environment. However, the use of radar remote sensing has many advantages in comparison with optical remote sensing techniques. By far the most important factor is the virtual insensitivity of radar to atmospheric conditions. This allows the regular collection of site observations independent of cloud cover or time of overpass. On the other hand, the interpretation of radar imagery over land area is not as straightforward as that of the more commonly used visible and infrared remote sensors. This study was carried out in the framework of EC/ASCEAN ERS-1 Radar Remote Sensing Project.
The objective of the study is to derive backscatter values from three main classes of vegetation, namely, matured rubber and oil palm plantations as well as paddy in the study area of Kuala Terengganu from ERS-1 multi-temporal data to analyze if it is possible to differentiate between the vegetation from the data. Backscatter simulations have been carried out by using the University of Texas at Arlington (UTA) Radioative Canopy Model in order to make comparisons with the ERS-1 data and to improve physical understanding of the backscatter properties of the vegetation classes under study. From the results, it can be concluded that the differentiation of matured oil palm and matured rubber is difficult even with multi-temporal data. But, in the case of paddy it is possible to differentiate it from other vegetation with multi-temporal data due to the difference in backscatter values during the growing cycle.
Introduction
Satellite remote sensing using the visible and the infrared wavelengths have been used very successfully in various applications related to earth resources studies and monitoring of the environment. However, it is not very suitable in the tropics because of the cloud cover problem. Radar remote sensing can overcome the problem although it may not possess some of the advantages of sensing in the optical wavelengths.
On the other hand, the interpretation of radar imagery over land is not as straightforward as that of the more commonly used visible and infrared remote sensors. Usually, special image processing techniques must be applied on the radar imagery to make it more readily interpretable. Furthermore, the interpretation of the backscattering process that underlies the radar image formation must be well understood with respect to the physical characteristics of he targets under observation and the specifies of the radar instrument.
This paper reports on some of the results obtained in the Terengganu study area (Figure 1) of the MAL-2 EC-ASEAN ERS-1 Radar Remote Sensing Project.
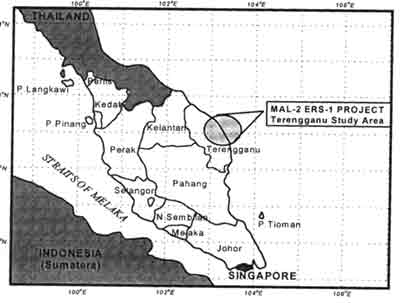
Figure 1: Location map of study area.
Backscatter from ERS-1 SAR DATA
The digital values for the 3 dominant vegetation i.e. matured rubber and oil palm as well as paddy were extracted at various locations. A mean value was obtained and converted to dB values. These values were obtained from the SAR data acquired on 8 different date. Figure 2 shows the graph of dB values for these vegetation types obtained from the ERS-1 SAR data acquired during the eight different dates.
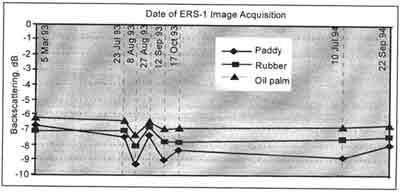
Figure 2: Backscatter values for paddy, rubber and oil palm extracted from the multi-data ERS-1 data.
Backscatter from model
In order to understood radar backscatter from vegetation, the University of Texas at Arlington (UTA) Radiative Transfer Canopy model (Karam et al., 1992) was used to derive backscatter values expected from the three dominant vegetation in the study area, i.e. rubber, oil palm and paddy. The parameters used in the model were obtained from ground observations which included tree height, soil roughness, soil moisture, leaf radius, leaf orientation, branch radius, branch density, trunk radius, trunk density, etc. Table 1 shows an example of parameter values for matured rubber plantation and Figures 3(a), 3(b) and 3(c) shows the graph of backscatter values obtained for three leave densities i.e. 30, 50 and 120 and three soil moisture values i.e. 0.1, 0.2, 0.35 and 0.5.
| Height of upper, middle and lower layer | 4.0 m, 2.4 m , 5.9 m |
| Soil roughness : rms height and autocor, length | 1.2 cm, 24 cm |
| Soil moisture | Variable |
| Soil texture: sand and clay factions | 0.50, 0.25 |
| Leaf scatterer classes: total, upper, middle and lower | 1,1,0,0 |
| Leaf radius and half-thickness | 3.5 cm, 0.2 mm |
| Leaf moisture content | 0.55 |
| Leaf density | Variable |
| Leaf orientation | 120, 0, 90, 30, 1 |
| Branch/trunk scatterer classes: total, upper , middle and lower | 4, 2, 1, 1 |
| Branch radius | 0.265 cm, 1.05 cm, 10 cm |
| Branch half-length | 4.5 cm, 23.5 cm, 120 cm |
| Branch moisture content | 0.50, 0.50, 0.50 |
| Branch density | 4.37, 0.467, 0.033 |
| Branch orientation | Spherical, spherical, spherical |
| Trunk radius and half-length | 18 cm, 295 cm |
| Trunk moisture content | 0.48 |
| Trunk density | 0.0067 |
| Trunk orientation | Vertical within 4 degrees |
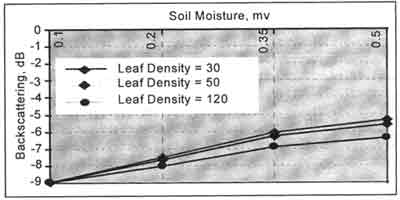
Figure 3(a): Backscatter values for rubber derived from the UTA model
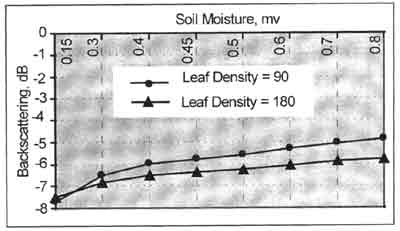
Figure 3(b): Backscatter values for oil palm derived from the UTA model
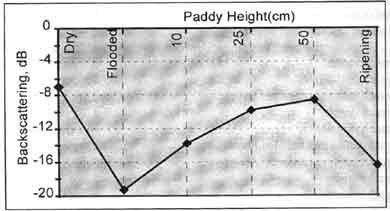
Figure 3(c): Backscatter values for paddy derived from the UTA model
Results & Discussions
The vegetation backscatter simulation results show that rubber plantations have a fairly stable backscatter level of -7.0 dB (Figure 3(a)). The backscatter values obtained from ERS-1 data also show a fairly stable signal around -7.5 dB (Figure 2). For oil palm plantations, the results from the model and the ERS-1 data show the same trend as for rubber with a fairly sable signal in the range of -6.0 to -7.0 dB (Figure 3(b) and (2). As for paddy fields, the simulations sow that the backscatter can be very low for flooded bare fields, but can be considerably higher as a result of wind or when the area is dry. When the fields, but can be considerably higher as a result of wind or when the area is dry. When the fields, but can be considerably higher as a result of wind or when the area is dry. When the plant grows the backscatter continuously increases up to -8.0 dB and drops again when the plant ripen or turn yellow. The results obtained from the ERS-1 data range from -6.7 to -9.0 dB (Figures 3(c ) and 2). These results are acceptable considering the fact that the ERS-1 data used in the study were acquired during mid to end of the paddy season. The results are in fair comparison with experimental data for the Thai-1 ERS-1 project on rice monitoring as given in the EC-ASEAN Newsletter Issue 3 (1995).
The results indicate that it is not possible to differentiate matured oil palm and matured rubber since they give similar backscatter values. On the other hand, paddy could be differentiated more easily by analyzing the ERS-1 SAR multi-temporal data since the backscatter values are different from the other two crops and also different for different stages of growth of paddy. The difference is pronounced in the three data colour composite produced from ERS-1 SAR data acquisition during the early, middle and late stage.
Conclusions
The results of the study indicate that it is not possible to differentiate between matured rubber and oil palm since the backscatter values are similar. However, it is possible to differentiate paddy from the other two vegetation types.
Acknowledgments
The authors wish to thank EC/ASEAN for funding the project and to Dr. D. H. Hoekman of Wageningen Agriculture University, the Netherlands for his technical advice.
Reference
- EC-ASEAN ERS-1 SAR Project (1995). Newsletter : Issue 3.
- Karam, M. A., Fung, A. K., Lang, R. H., and Chauhan, N. S. (1992). A Microwave Scattering Model for Layered Vegetation. IEEE Transactions on Geoscience and Remote Sensing, Vol. GE-30, pp. 767-784.