| GISdevelopment.net ---> AARS ---> ACRS 1997 ---> Poster Session 3 |
Integration of Remote Sensing
and GIS Techniques for Landside Applications
Richard Kho Shu Yuan and
Mohd. Ibrahim Seeni Mohd.
Faculty of Geoinformation Science and Engineering
Universiti Teknologi Malaysia
Locked Box 791, 80990 Johor Bahru
Tel-: 017-5502880, Fax: 07-5566163
E-mail : mism@fksg.utm.my
Abstract
Faculty of Geoinformation Science and Engineering
Universiti Teknologi Malaysia
Locked Box 791, 80990 Johor Bahru
Tel-: 017-5502880, Fax: 07-5566163
E-mail : mism@fksg.utm.my
Remote sensing has been used to study characteristic properties of ground surface due to the advantages of its broad area observation and periodicity. The integration of GIS with remote sensing data and thematic map data may facilitate greatly the assessment and estimation of regional landslide hazards. In the study, land surface temperature and land use information have been derived from Landsat Thematic Mapper data. The elevation and slope inclination have been determined from DEMs generated from aerial photographs. Underground water level information has been obtained from the combination of the above data. From these data, simple algorithms were used to classify the area into different risk zones. By combining all the risk maps using GIS techniques, final risk maps were produced which take into account all the above factors.
1.0 Introduction
Landslides have become one of the world's major natural disaster for the past few years in may countries. Prediction of potential landslide areas have been very difficult because of the complexity of the factors involved and the relationship to each other which is wide ranging. The factors which are usually related to landslides are geology, soil type, land surface temperature, land cover, underground water level, slope aspect, slope inclination, elevation, etc. Normally the causes of landslide are determined by carrying out some sampling of the soil , rock, slope inclination, land cover, underground water level, geology, etc. at the site. It is difficult and time consuming to do this for a large area from time to time and by integrating it with GIS, all the information can be combined, manipulated and analysed to determine potential landslide areas. The objective of this study is to determine a suitable methodology of predicting possible landslide areas in the study area of Grenting Sempah which covers an area 8 x 10 km (figure 1) using the Landsat-5 TM data and aerial photographs with GIS techniques using the IL WIS software.
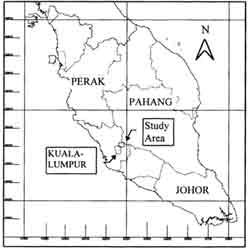
Figure 1 : Location of the study area.
2.0 Data Processing and Information Extraction
In the study, various types of data were used to extract relevant information. These include the use of Landsat-5 TM data in the extraction of land surface temperature, land use information and underground water level and aerial photographs in the derivation of digital Elevation, Model (DEM). However, some other relevant ancillary data such as geology, soil types, rainfall, etc have not been considered.
2.1 Land Surface Temperature
The land surface temperature which is closely related to underground water level is usually used by researchers to predict landslide potential areas. The Landsat-5 TM band 6 data was corrected for atmospheric effects and the land surface temperature was calculated. The result is shown in figure 2 where the temperature ranges from 24°C- 34°C. According to past researches (Shikada, 1994), most landslide areas have temperature between 24-26 °C.
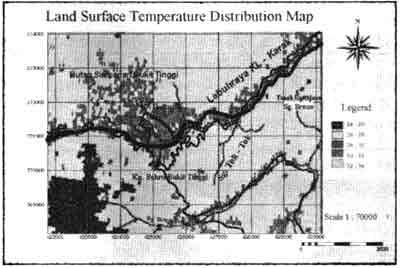
Figure 2 : Land surface temperature.
2.2 Digital Elevation Model
The DEM for this study was generated from a pair of aerial photographs. The slope inclination map was generated from the DEM. Both the DEM and slope inclination maps were density sliced by using certain algorithms to produce the landslide risk map. The 3D view of the DEM for the study area is shown in figure 3. From past researches (Gao, 1995), most of the landslides occur at elevation of 400-500m and slope inclination of 35°-45°.
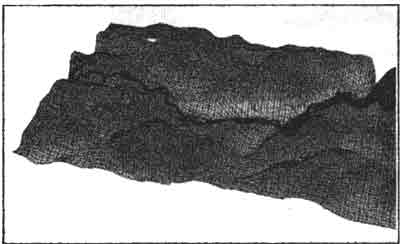
Figure 3 : DEM 3 D view
2.3 Land Use Map
A land use map was produced from the Landsat-5 TM data. The land use for the study area is classified into 4 types i.e. forest, bush, agricultural and residential by using the nearest neighbour method of supervised classification techniques. The land use map as shown in figure 4 is then density sliced into different risk zones based on the study of Morgan (1986).
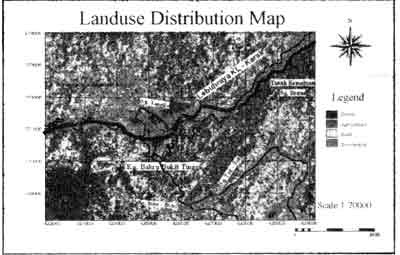
Figure 4 : Land use map.
2.4 Underground Water Level Map
The underground water level map was produced from the combination of the above data which include the slope inclination, elevation, band 6 DN values and Normalised Difference Vegetation Index (NDVI). The result is as shown in figure 5 with other underground water level ranging from 0-18m. Wet and agriculture areas have shallow water. According to Takagi [1991], most landslides occur at ground level of 3-6m.
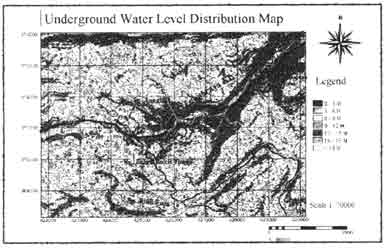
Figure 5: Underground water level map
3.0 Results and Discussions
All the data were manipulated by using the ILWIS 2.02 software. The data were classified into different risks zones and the risk maps were combined to produce final risk maps (figure 6 & 7). Figure 7 shows the most of the risk areas are located in areas near the road side and at agricultural areas. These areas have temperatures between 24-26°C, slope inclination between 400m-500m and underground water level between 3-6m. Although there is no evidence to prove that these areas are riskily, the combination of the above factors indicate that these areas are more risky than other areas in the study area.
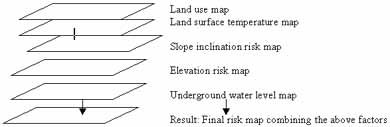
Figure 6: GIS spatial database.
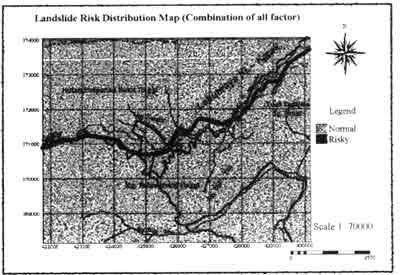
Figure 7 : Landslide risk map from combination of all factors.
4.0 Conclusion
The study shows that remote sensing techniques when integrated with GIS can provide a useful tool to study potential landslide areas. However, the accuracy of the final results depends in the parameters that are included in the data set. In this study, no all the necessary parameters have been included due to lack of data.
References
- Gao, J. Lo, C. P. (1995), Micro-Scale Modelling of Terrain Susceptibility to Landsliding from a DEM : A GIS Approach, Geocarto International, Vol. 10, No. 4, ms. 15-30.
- Morgan, R. P. C. (1986), Soil Erosion and Conservation, Longman Group UK Limted
- Shikada, M. Kusaka, T., Kawata, Y. and Miyaki, K., (1994), Extraction of Characteristic Properties in Landslide Areas Using Thematic Mapper Data And Surface Temperature, Geoscience and Remote Sensing Sym., (IGARSS), Vol. V, ms. (103)-105.
- Takagi, M. and Murai, S. (1991), Inference of Landslide Area from Landsat TM and DTM data, Proc. of The 12th Asian Conf. on Remote Sensing, Singapore, ms. J-4-1-J-4-5.