| GISdevelopment.net ---> AARS ---> ACRS 1997 ---> Poster Session 3 |
Monitoring NDVI of North
Korea using NOSS AVHRR data exploring the possibility of early warning
system of agricultural production
Yoshide Sekimoto, Hiroaki
Kndo and Ryosuke Shibasaki
Institute of Industrial Science, University of Tokyo
7-22-1, Ropppngi Minato-Ku Tokyo 106, Japan
Tel : (81)-3-3402-6231- Fax: (81)-3-3408-8268
E-mail : suzaki@shunji.iis.u-tokyo.ac.jp
Abstract
Institute of Industrial Science, University of Tokyo
7-22-1, Ropppngi Minato-Ku Tokyo 106, Japan
Tel : (81)-3-3402-6231- Fax: (81)-3-3408-8268
E-mail : suzaki@shunji.iis.u-tokyo.ac.jp
In Asian countries with rapidly growing population and economy, there may be some possibilities of good shortage triggered by natural/human-induced disasters such as flood and drought. Monitoring agricultural production by remote sensing data is expected to by very helpful for providing country measures as early as possible. To explore the possibility of agricultural production monitoring on the real time basis, the authors examined changes o NDVI values of North Korea.
1. Introduction
In Asian countries with rapidly growing population and economy, there may be some possibilities of food shortage triggered by natural/human-induced disaster such as flood and drought. Monitoring agricultural production by remote sensing data is expected t be very helpful for providing countermeasures as early as possible. UNFAO is also making efforts to cover Asian regions with the network of "early winning system" based on remote sensing images. The objective of this study is to explore the possibility of early warning system based on satellite remote sensing data through the comparison of NDVI values of North Korea of 1992 and 1997.
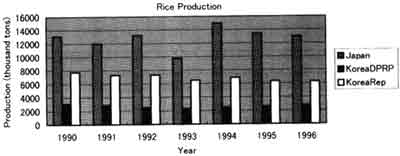
Fig. 1 North Korea rice production in 90's comparing with other countries (UNFAO)
| Total Availability | 3032 | Total Utilization | 4966 | Import requirement | 1934 |
| -Production | 2874 | -Food use | 3798 | -Commercial Imports | 430 |
| -Opening stocks | 158 | -Feed use | 400 | -Food assistance (pledged & delivered) | 323 |
| -Other uses (seed, losses and industrial use) | 452 | -Uncovered import requirement | 1181 | ||
| -Closing stocks | 316 |
2. Data Acquisition / processing
We use NOAA AVHRR data which we receive at Institute of Industrial Science, University of Tokyo and focus on the data acquired at three p.m. in August 1997 and 1992. For an analysis of the data we use PaNDA (Package for NOAA Data Analysis), free software, which includes radiometric correction and geometric correction. In order to remove the effects of the cloud cover as possible we made 10 day composite of NDVI image by choosing the maximum NDVI value over each 10 day at each pixels. The following formula is applied to the computation of NDVI values.
| NDVI = 260 x | Ch.2(near infrared)-Ch.
1(visible) ------------------------------ Ch.2 + Ch. 1 |
+ 15 |
This formula has been used by UNEP-GRID(United Nations Environmental Program - Global Resource Information Database). Ch.1 and Ch. 2 respectively denote channel values of ch. 1 (visible) and ch. 2(near infrared) of NOAA AVHRR data. Flowchart of the data processing is presented in Fig. 2.
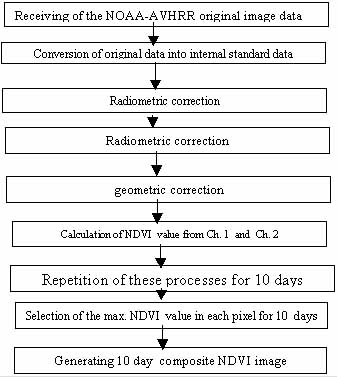
Fig. 2. Flowchart of the data processing
Result
Fig. 3. is a map of Korea Peninsula. We assume low fat area is almost agricultural land in North Korea.
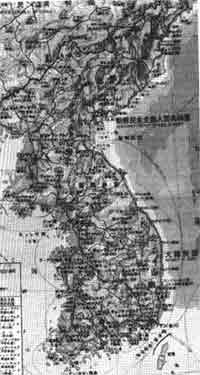
Fig. 3. Map of the Korea Peninsula (conic projection)
(Copyright © Teikokushoin Co., Ltd.)
Fig. 4 and Fig. 5. is the NDVI image of Korea in Aug of 1992 and 1997. The data of 1992 have some noses in the northern part of the Korea Peninsula. Except these noises, we can see some changes, which indicate the decline of NDVI value, in the low fat area of North Korea. (darker area corresponds lower NDVI area on the gray scale). On the other hand, it seems that in South Korea almost all area maintains approximately the same NDVI value. (It should be noted that the NDVI values are low because of clouds in the east of South Korea.)
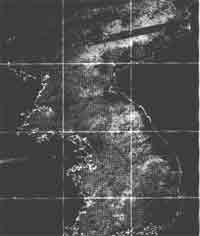
Fig. 4. NDVI image of Korea Aug/1992 (Mercator projection)
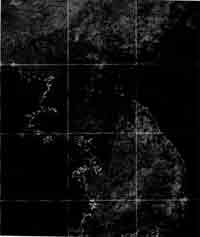
Fig. 5. NDVI image of Korea Aug/1997 (Mercator projection)
Conclusions and Future Prospects
In North Korea, relative higher NDVI values are observed in 1992 rather than in 1997, while South Korea almost all area keeps the same values approximately. We can conclude NDVI data from AVHRR data can be used for detecting relatively large-scale decline of agricultural production. The problem remained to be solved are
- how to prevent geometric correction errors in case of its is hard to capture coastal lines for GCP's due to cloud over.
- how to calibrate fluctuations of NDVI values by observational time.
- how to remove occasional noises and clouds.
The following are further perspectives.
- By comparing with the images of Landsat, we will check how accurate this observation from AVHRR data is.
- Based on this case study in North Korea, we will explore the possibilities of anticipating the crisis of food shortage using a satellite data on the real-time basis.
- PaNDA Committee, 1993, PaNDA operation manual, PaNDA Committee.
- 1997. FAO/WFP crop and food supply assessment mission to the Democratic People's Republic of Korea, FAO Global Information and Early Warming System on Food and Agriculture World Food Program SPECIAL ALERT NO. 1275/06/97.
- JARS, 1996. Wakariyasui remote sensing system and geographic information system, JARS : 166-167. (in Japanese)