| GISdevelopment.net ---> AARS ---> ACRS 1997 ---> Poster Session 3 |
Development of land cover
classification method using Noaa Avhrr, Landsat TM and DEM images
Junichi Suzuki and Ryosuke
shibasaki
Murai-Shibasaki Lab., Institute of Industial Science, University of Tokyo
7-22-1, Roppongi, Minato-ku, Tokyo 106, Japan
TEL : +81-3-3402-6231 ex. 2562- FAX: +81-3-3479-2762
E-mail : suzaki@shunji.iis.u-tokyo.ac.jp
Abstract
Murai-Shibasaki Lab., Institute of Industial Science, University of Tokyo
7-22-1, Roppongi, Minato-ku, Tokyo 106, Japan
TEL : +81-3-3402-6231 ex. 2562- FAX: +81-3-3479-2762
E-mail : suzaki@shunji.iis.u-tokyo.ac.jp
For classification of areas including land cover whose spectral characteristics show annual big changes, it is necessary to prepare series data and consider the changes. And there still remains a problem that some land covers are confusing to be classified because of their similarity of spectrum characteristics, which is though to be solved by texture analysis with use of high resolution data. So, our target is to establish a system of land cover classification, considering time series change of spectral characteristics, texture of land covers and slope of elevation, in which appropriate data are applied at each stage among NOAA AVHRR, Landsat TM and DEM data.
1. Introduction
Recently, emphasis has been focused on environment issues and in this context, large-scale land cover change are being required in order to achieve it, the land cover at each stage should be determined. That's why classification method of large-scale land cover has become more and more important.
First of all, they're few researches which deal with classification of large-scale land cover, e.g. peninsular land cover. Moreover, some of them tried simple classification (e.g. forest or non-forest classification dealt in Skole et al., 1994). In future, besides forest, such land covers as show human impact, like crop field or paddy field, will be required to classify even in the large-scale area.
Next, most of the traditional classification method for small or limited are dealt with temporary remotely sensed data. In such cases, there's chance to overlook the land cover showing a big, seasonal change in special characteristic, like deciduous forest. Benedetti and Rossini (1994) had overcome the problem in classification of the vegetation around the Mediterranean Sea by multi-temporal NOAA AVHRR data. Consideration of temporal chance in spectral characteristic, but there still remains another problem that it 's difficult to classify the land covers which show similar spectral characteristic in a relatively large scale image, like crop field and grassland.
On the other hand, texture analysis has been done as a useful classification method (Derek and Steven, 1991: Patrick and Egid, 1991; Sali and Wolfson, 1992). This method proved to be powerful especially in classification of artificial structures.
So, we have made a structure of classification of large-scale land covers, combining multi-temporal data analysis and texture analysis, and have tested it for the area which is almost as large as one scene image detected by Landsat TM.
2. Methodolgy
We focused as classes of classification on evergreen forest, deciduous forest, crop field, grassland, and paddy field, considering land covers which show human impacts in the context of environmental issue. As for each land cover, we examined the clues in terms of seasonal change in spectral characteristic, texture and elevation.
2-1 Seasonal change in spectral characteristic
Now NOAA AVHRR is available to provide as multi temporal data more easily than then sensor.
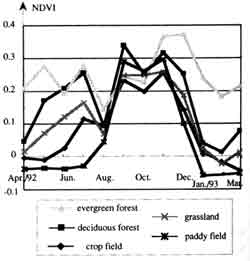
Figure 1. Seasonal change in spectral characteristic
We examined multi-temporal change of NDVI of the above five land cover sin then other part of Thailand (Figure 1). It can be seen that the NDVI of evergreen is relatively high through the year, that there's a gap between the NDVI of deciduous forest the one during dry season (from Jan. to Apr.) and the one during other season and paddy field is also like that, and that crop and grassland show similar NDVI trails.
These facts lead to the below guesses.
- Evergreen, forest may be identified by the average of NDVI, especially the average one during dry season.
- Deciduous forest and paddy field may be classified by each seasonal difference in the maximum and minimum of NDVI.
- It may be difficult to determine crop from grassland only by using NDVI sensed by AVHRR.
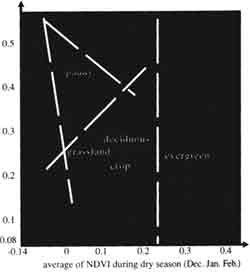
Figure 2. Relationship between average of NDVI during dry season and annual difference of NDVI
That's why it can be said that evergreen forest and paddy field are classified by considering seasonal change in spectral characteristic.
2-2 Texture
So far, some statistical indices are proposed and tried to classify land covers, e.g. angular second moment, entropy, inverse difference moment (Derek and Steven, 1991). In this research, such statistical indices were tested but it failed to classify clearly.
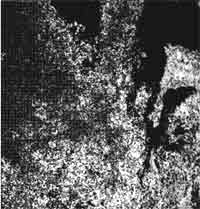
Then, we focused on "wavelet transform (Shi and Shibasaki, 1996)", and did texture analysis by it. Through wavelet transform analysis, the image showing edges can be produced (Figure 3). If we define some continuous edges as "an edge line", it was found that edge lines can be a tool to classify land covers, especially to discriminate crop from grassland.
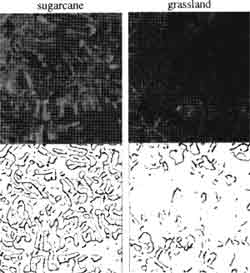
Figure 3. Texture analysis results
(upper : Landsat TM NDVI images)
( lower : edge-extracted results by wavelet transform analysis )
In this context, texture analysis by wavelet transform may be used to tell crop from grassland.
If Elevation data is used in itself, the method cannot be said as general because the elevation of each land cover is deeply dependent on its geography.
So, the slope of the elevation was examined in the Figure 4 by using DEM (Digital Elevation Model). The small slope image almost coincides the area paddy fields. On the other hand, the high slope image is related to forest and mountains, including evergreen and deciduous forest.
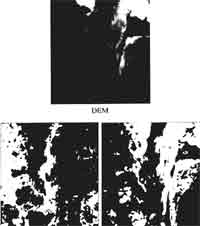
Figure 4. Relationship between DEM and slope
Thus, the slope of the elevation can be applied for the classification of paddy field, deciduous forest, and evergreen forest.
2-4 Land cover classification method
Considering the above characteristics, we have made a flow of classification of land covers, combining multi-temporal data analysis and texture analysis and elevation analysis (Figure 5).
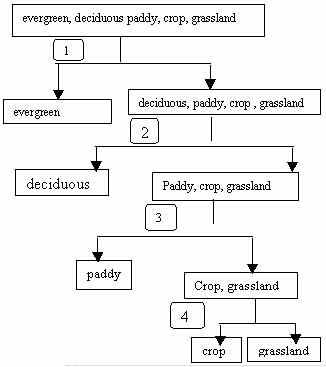
2 : Level Slicing in Figure 2 & Level slicing in Figure 4
3 : Level slicing in Figure 2 & Level slicing in Figure 4
4 : Texture analysis
- Evergreen forest is determined by level slicing in Figure 2, because its highest NDVI average during dry season of all land covers is the easiest and most efficient criterion.
- After evergreen forest area is masked, deciduous forest is classified by level slicing in both. Figure 2 and Figure 4, because of its big annual NDVI's difference and high slope.
- After deciduous forest area is removed too, paddy field is identified by level slicing in both Figure 2 and Figure 4, because of its characteristic in Figure 2 and low slope.
- As for the rest areas, crop field and grassland, texture analysis (wavelet transform analysis) is done and the area which show some lines is identified as crop, otherwise grassland, because in this research crop is defined as the area affected by human impacts and showing a kind of linear characteristic.
The test scene is the northern part of Thailand and almost equivalent to the Landsat TM image size. And data used in this research is geometrically corrected to overlay.
- NOAA AVHRR NDVI (1992.4-1993.3)
- Landsat TM #58 (1989.1.20)
- Dem (1km)
As the first stage, we produced and validated three images, the image classified by multi-temporal analysis and elevation analysis in this paper, the only classified by maximum likelihood method (MLM) using 12-month NOAA AVHRR data, and the one by MLM using Landsat TM data (Figure 6, 7 and Table 1).
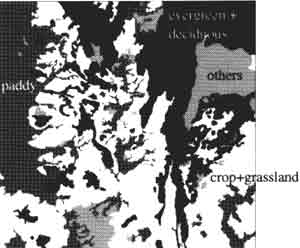
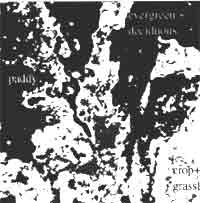
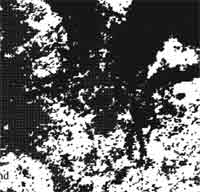
Figure 6. Land use map (1990)
The method proposed in this paper
Maximum likelihood method (12-month NOAA AVHRR NDVI)
Maximum likelihood method (Landsat TM band 2, 3 and 4)
Figure 7. Results classified into 3 classes (evergreen forest + deciduous forest, paddy, crop + grassland)
| Classified result | ||||
| Land use map | Proposed method | Maximum likelihood method (NOAA AVHRR) | Maximum likelihood method (Landsat TM) | |
| Paddy 49073 | Paddy 34723 : 70.8% | Paddy 35250 : 71.8% | Paddy 32600: 66.4% | |
| Crop etc. 13966 : 28.5% | Crop etc. 10840 : 22.1% | Crop etc. 14211: 26.6% | ||
| Forest 384 : 0.8% | Forest 2983 : 6.1% | Forest 2262 : 4.6% | ||
| Crop + 90433 grassland | Paddy 18719 : 20.7% | Paddy 21043 : 23.3% | Paddy 31943 : 35.3% | |
| Crop etc. 59228 : 65.5% | Crop etc. 49416: 54.6% | Crop etc. 46878 : 51.8% | ||
| Forest 12486 : 13.8% | Forest 19974 : 22.1% | Forest 11612 : 12.8% | ||
| Forest 65329 (evergreen + deciduous) | Paddy 993 : 1.5% | Paddy 2320 : 3.6% | Paddy 9956 : 15.2% | |
| Crop etc. 10347 : 15.8% | Crop etc. 10915 : 16.7% | Crop etc. 22022 : 33.7% | ||
| Forest 53985 : 15.8% | Forest 52094 : 79.7% | Forest 33351 : 51.1% | ||
| Other 23644 | ||||
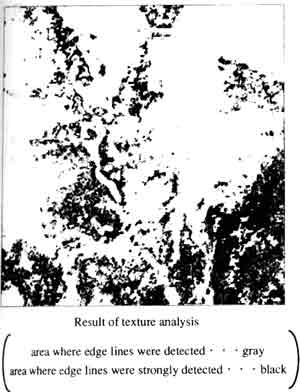
Result of texture analysis.
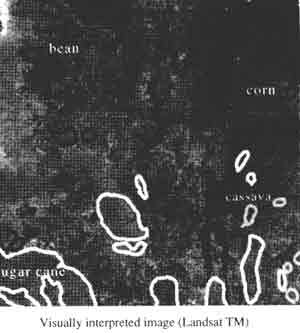
Visually interpreted image (Landsat TM)
(area where edge lines were detected . . . gray )
(area where edge lines were strongly detected . . . black)
Figure 8. Comparison of result of texture analysis with visually interpreted image.
Next, the result by texture analysis was compared with visually interpreted Landsat TM image (Figure 8).
Finally, the image classified into five classes was shown in Figure 9.
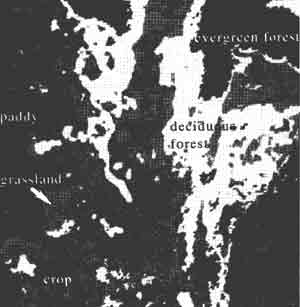
Figure 9. Classified result (5 classes)
4. Discussion
Table 1 shows that the result classified by MLM using temporal Landsat TM data tends to overlook forest (evergreen forest and deciduous forest). forest and deciduous forest). Considering this data were detected in January, that's because the special characteristic of deciduous forest without leaves are similar in the one of crop and grassland. It can be said that there's a limitation of classification method using temporal data alone.
When comparing the result classified by the method in this research and the one classified by MLM using NOAA AVHRR data, we focus on the misclassified result, e.g. forest in land use map classified into paddy field. While the rate of that misclassification is high in the result of classification by the proposed method. It can be said that using the slope of the elevation prevented from misclassification, and it brought better accuracy.
Any seeing Figure 8, texture analysis is useful to discriminate crop field which show linear characteristic, especially sugar cane, from grassland. But, other crop field which show little linear characteristic, like bean, are not clearly identified. That's because in this research, crop is defined as the area affected by human impacts and which show linear characteristic. So, in this sense, it can be said texture analysis by wavelet transform analysis can be used to detect crop field which has linear characteristic.
5. Conclusion
In this paper, we have made a structure of classification which may be applied for large- scale land covers and could show the above.
- To consider seasonal change in spectral characteristic, we focused on the relationship between the average of NDVI during dry season and the annual difference of NDVI and could use it as a criterion to classify evergreen forest, deciduous forest and paddy field.
- Wavelet transform analysis was done as a method of texture analysis and provide to be useful to discriminate crop field from grassland if crop is defined as the area which show linear characteristic.
- The information of the slope of the elevation could be useful to classify deciduous forest and paddy field.
- Benedetti, R. Rossini, P., and Traddei, R., 1994. Vegetation classification in the Middle Mediterranean area by satellite data. International Jornal of Remote Sensing, 15, 583-596.
- Derek, R. P., and Steven E. F., 1991. Image Texture Processing and Data Integration for Surface Pattern Discrimination. Photogrammetric Engineering & Remote Sensing, 57, 413-420.
- Patrick, A. A., Egide, N., 1991. Comparisons between Spectral Mapping Units Derived from SPOT Image Textureandield Soil Map units. Photogrammetric Engineering & Remote Sensing, 57, 397-405.
- Sali, E., and Wofson, H., 1992. Texture classification in aerial photograph and satellite data. International Journal of Remote Sensing, 13, 3395-3408.
- Skole, D. L., Chomentowski, W. H., Salas, W. H., and Nibre. A. D., 1994, Physical and human dimensions of deforestation in Amazon. BioScience, 44(5), 314-32.
- Shri, Z., and Shibasaki, R., 1996. Wavelet Analysis and Its Application. Jornal of the Japan Society of Photogrammetry and Remote Sensing, 35, No.2, 3 and 4, 48-52, 51-55, 53-58.