| GISdevelopment.net ---> AARS ---> ACRS 1997 ---> Poster Session 3 |
Suitability Assessment of A4
Format Desktop Publishing Scanners
Wan Mohd Naim b. Wan
Mohd.
Department of Surveying Science and Geomatics
MARA Institute of Technology, Shah Alam, Selangor, Malaysia
Tel: 03-5564423
Email : naim@sug.engr.itm.edu.my
R. P. Kirby
Department of Geography
University of Edinburgh, U. K.
Abstract Department of Surveying Science and Geomatics
MARA Institute of Technology, Shah Alam, Selangor, Malaysia
Tel: 03-5564423
Email : naim@sug.engr.itm.edu.my
R. P. Kirby
Department of Geography
University of Edinburgh, U. K.
High quality scanners are needed to convert the existing hardcopy aerial photographs to digital format. Although there are many types of photogrammetric scanners available in the market today, their price is still quite high. In contrast, A4 format desktop publishing (DTP) scanners are easily accessible to the general public because of their low cost. One of the problems associated with this type of scanner is the insufficient geometric accuracy caused by the mechanical instabilities, large lens distortions and imperfections of other mechanical parts such as mirrors or filters. This papers results of the geometric accuracy assessment of four different types of A4 format DTP scanners.
Introduction
Photogrammetry has been widely recognized as an important method of acquiring digital topographic information for GIS. Unlike the traditional photogrammetric method where by hardcopy aerial photographs (i. e. paper prints or diapositive) are needed, digital photogrammetry can accept data from any other sources such as stereo SPOT satellite imagines, images from CCD camera and scanned aerial photographs. In a Developing Country like Malaysia, where stereo SPOT satellite are not widely available users have to rely on existing aerial photographs s the main data source to a digital photogrammetric system.
Scanned aerial photographs are an integral part of digital photogrammetry from which it I possible to produce ortho-rectified images, ortho-images ,digital elevation models (DEM), map overlays and other products which can be used in GIS. To enable high quality products to be generated, it is essential to have geometrically and radiometrically correct images. Although high quality scanners such as the Zeiss/Intergraph Photogrammetric application, their price is quite high. On the other hand, DTP scanners are cheap general purpose scanners for converting hardcopy drawings or photographs into digital format. These types of scanners can either be in A3 or A4 format.
Carstensen and Cambell (1991) have argues that, although these scanners are not designed to be used for photogrammetric applications, they have greater potential than their manufacturers suggest. These scanners have excellent spatial resolution, a relatively low, though adequate and improving radiometric resolution, and competitive prices. According to Baltsavias (1994), some of their components like sensors, electronics, computer platforms, software, and characteristics like radiometric performance and speed are equivalent or better than those of expensive photogrammetric scanners.
Although many earliest studies (Baltsavias, 1994a; Finch and Miller, 1994; Gagnon and Argnard, 1992; Sarjakoski, 1992) have identified the potential of some of the A3 format scanners such as the Sharp JX -610 and Agfa Horizon Plus for digital photogrammetric applications, the price of acquiring A3 scanners is still high for small organizations. A4 format scanners are the cheapest, and seem to be feasible alternative for these organizations.
Assessments of A4 format DTP scanners
Although A4 scanners are cheap, the user community is widely unaware of their limitations. The issues relating to the accuracy need to be assessed and publicized. Among the issues and questions that need to be addressed are:
- What is the pattern and magnitude of distortions of images scanned in A4 format DTP scanners?
- What is the effect of scanning resolution on the pattern and magnitude of image distortion?
- What is the best mathematical formulae to be used to model and rectify distortions of images scanned in A4 format DTP scanners?
- What are the optimum number and arrangement of the image control points required to rectify image distortions?
- How repeatable are scanner measurements over time?
Distortion pattern and the magnitude of distortion of image scanned in DTP scanners
The main aim of this test was to determine the distortion pattern and magnitude of image distortions scanned in five DTP scanners. Four different types of DTP scanners were used, that is Apple Colour OneScanner, HP Scanjet IIc scanner, Epson GT-9000 scanner and HP Scanjet 4C (two scanners of this type were used). The choice of these scanners was based strictly on their availability. To quantify the errors, a calibrated grid plate (used to calibrate stereoplotting machines) with a regular 1 cm grid was used. A total of 47 points (25 control and 22 check points) were measured.
Results and analysis
The resultant vector error plots of image distortion pattern at the control points for the 300 and 600 dpi images scanned in the Apple, HP Scanjet IIC, Epson and the two HP Scanjet 4c scanners are shown in Figure 1. Since the calibrated grid plate is considered error free, the distortion pattern and the magnitude of distortion of the scanned images can be considered as due to scanner error. In all the figures, the systematic nature of the distortion pattern can clearly be seen, although the distortion patterns of images scanned in different scanners differ significantly (including images scanned in two scanners of the same model). Only the distortion patterns of images scanned at 300 and 600 dpi in the Apple scanner are similar.
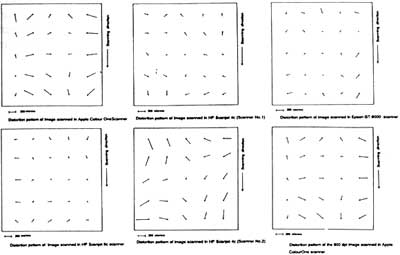
Figure 1. Distortion pattern of different DTP scanners.
The summary of results on the magnitude of image distortions for the Apple, HP, Epson and HP Scanjet 4c scanners is given in Table 1.
| R.m.s.e. at Control points (in pixel) | R.m.s.e. at Check-points (in pixel) | Max. Error at Control points (in pixel) | Max. Error at Check points (in pixel) | |
| Scanner | Mx My Mv | Mx My Mv | Ex Ey Ev | Ex Ey Ev |
| Apple Colour One Scanner* | 3.41 2.27 *4.01 | 3.35 2.20 4.00 | 6.03 5.98 6.03 | 5.92 5.61 5.92 |
| Apple Colour OneScanner | 1.97 1.21 2.31 | 1.80 1.34 2.24 | 3.51 2.63 3.65 | 3.35 2.33 3.59 |
| HP Scanjet lic | 0.83 0.50 0.97 | 0.79 0.45 0.91 | 2.02 1.08 2.02 | 1.96 0.93 1.96 |
| Epson GT-9000 | 0.80 0.75 1.19 | 0.71 0.71 1.00 | 2.01 1.62 2.06 | 1.49 1.67 2.19 |
| HP Scanjet 4c (Scanner 1) | 0.84 0.73 1.11 | 0.68 0.78 1.04 | 1.56 1.42 1.61 | 1.33 1.59 1.62 |
| HP Scanjet 4c (Scanner 2) | 1.89 1.82 2.62 | 1.87 1.93 2.67 | 4.21 3.28 4.41 | 3.82 3.75 3.82 |
From Table 1 it can clearly be seen that the magnitude of image distortion of he five scanners tested differ from one another. The original magnitude of image distortions in the Apple Colour OneScanner is more than twice the scanning resolution while for the HP Scanjet IIc Epson scanners the distotion is approximately the same as the scanning resolution. Compared to the HP Scanjet IIc, Epson and HP Scanjet 4c (Scanner 1) scanners, the magnitude of image distortions in the Apple Colour OneScanner is approximately twice as large. Different scanners of the same model (HP Scanjet 4c) gives different magnitude of image distortions. Although the overall magnitude of image distortion in the HP Scanjet IIc, Epson and HP Scanjet 4c (Scanner 1) scanners is not significant, the maximum resultant error at certain location within the image is still large (approximately twice the scanning resolution).
Suitable Mathematical Model to Eliminate Image Distortion
The earlier test shows the distortions of image scanned in A4 format DTP scanners are quite significant, which poses the question of how distortion of images scanned in these scanners can be minimized. This test was aimed to test the suitability of using different mathematical models to minimize image distortions. The affine and polynomial transformation were used in this test.
Two-dimensional polynomial transformation
| X = a1 | constant term |
| + a2x +a3y | 1st order terms (affine) |
| + a4xy + a5x2 + a6+y2 | 2nd order terms |
| + a7x2y + a8xy2 + a9x3 + a10y3 | 3rd order terms |
| + a11x3y + a12xy3 + a13x4 + a14x2y2 + a15y4 | 4th order terms |
| Y = b1 | |
| +b2x + b3y | |
| + b4xy + b5x2 + b6y2 | |
| +b7x2y + b8xy2 + b9x3 + b10y3 | |
| +b11x3y + b12xy3 + b13x4 + b14x2y2 + b15y4 | |
where
X, Y-calibrated grid intersection coordinates a1, a2...a15 -transformation parameters
x, y -image coordinates b1, b2...b15 - transformation parameters
Results and analysis
Results of image distortions correction using both the affine and polynomial transformations for image scanned in different scanners is given in Table 2. The results in Table 2 have shown that while the magnitude of distortion of images scanned in some DTP scanners is significant it can be minimized by using a suitable mathematical model. The use of an affine transformation only helps to reduce the effect of image distortions in the y direction for images scanned in the Apple and HP scanners. The x2 term in the polynomial transformation helps to reduce the effect of distortion in the x direction. For the images scanned in Apple and HP Scanjet IIc scanners, the use of a third order polynomial helps to reduce image distortion to a minimum. The application of a third or fourth order polynomial helps to reduce image distortion to a minimum. The application of a third or fourth order polynomial makes the magnitude of distortions in the x and y directions the same and the resultant vector errors at the check points for the images scanned in Apple, HP Scanjet IIc and Epson scanners were found to be less than half a pixel. In both the HP Scanjet, the use of only a second order polynomial helps to reduce the image distortion to a minimum. There is no further improvement in the magnitude of distortions when higher order polynomials are used. A summary of suitable polynomial terms to be used in image rectification to obtain the best results (lowest r.m.s.e and lowest "maximum error") in different DTP scanners is given in Table 3.
| Polynomial order term | ||
| Scanner | Lowest r.m.s.e | Lower-Maximum error |
| Apple Colour One Scanner | Third/fourth | Third/fourth |
| HP Scanjet IIc | third | third |
| Epson GT-9000 | Third/fourth | Third/fourth |
| HP Scanjet 4 c (Scanner1) | second | Second |
| HP Scanjet 4c (Scanner 2) | second | Second |
|
| |||
| Rmse at control (pixel) |
Rmse at control (pixel)** |
Rmse at check (pixel) | |
| Transformation | X Y Vec | X Y Vec | X Y Vec |
| Linear conformal | 1.97 1.21 2.32 | 3.41 2.27 4.01 | 1.80 1.34 2.24 |
| Affine | 1.52 0.25 1.54 | 2.58 0.78 2.70 | 1.37 0.29 1.39 |
| 4 terms poly (xy) | 1.56 0.25 1.58 | 2.64 0.59 2.68 | 1.35 0.29 1.38 |
| 5 terms poly (x2) | 0.59 0.16 0.61 | 0.99 0.54 1.11 | 0.37 0.21 0.42 |
| 6 terms poly (y2) | 0.59 0.16 0.61 | 1.01 0.47 1.11 | 0.35 0.21 0.41 |
| 7 terms poly (x2y) | 0.59 0.16 0.61 | 0.96 0.49 1.08 | 0.31 0.21 0.38 |
| 8 terms poly (xy2) | 0.59 0.17 0.62 | 0.99 0.49 1.11 | 0.34 0.21 0.40 |
| 9 terms poly (x3) | 0.20 0.17 0.26 | 0.40 0.52 0.64 | 0.19 0.21 0.29 |
| 10 terms poly (y3) | 0.21 0.17 0.27 | 0.40 0.47 0.60 | 0.19 0.22 0.29 |
| 11 terms poly (x3y) | 0.21 0.18 0.27 | 0.40 0.45 0.59 | 0.19 0.21 0.29 |
| 12 terms poly (xy3) | 0.21 0.18 0.28 | 0.42 0.42 0.59 | 0.18 0.21 0.28 |
| 13 terms poly (x4) | 0.18 0.19 0.26 | 0.33 0.42 0.54 | 0.18 0.21 0.28 |
| 14 terms poly (x2y2) | 0.18 0.20 0.27 | 0.33 0.45 0.54 | 0.18 0.21 0.28 |
| 15 terms poly (y4) | 0.19 0.15 0.24 | 0.33 0.40 0.54 | 0.18 0.24 0.29 |
|
| |||
| Rmse at control (pixel) |
Rmse at check (pixel) | ||
| Transformation | X Y Vec | X Y Vec | |
| Linear conformal | 0.83 0.50 0.97 | 0.79 0.45 0.91 | |
| Affine | 0.69 0.24 0.73 | 0.67 0.24 0.72 | |
| 4 terms poly (xy) | 0.71 0.22 0.74 | 0.68 0.28 0.73 | |
| 5 terms poly (x2) | 0.39 0.21 0.45 | 0.45 0.27 0.52 | |
| 6 terms poly (y2) | 0.38 0.21 0.43 | 0.43 0.26 0.50 | |
| 7 terms poly (x2y) | 0.37 0.22 0.43 | 0.44 0.27 0.51 | |
| 8 terms poly (xy2) | 0.36 0.21 0.42 | 0.39 0.27 0.48 | |
| 9 terms poly (x3) | 0.33 0.21 0.39 | 0.36 0.27 0.46 | |
| 10 terms poly (y3) | 0.33 0.19 0.38 | 0.35 0.27 0.45 | |
| 11 terms poly (x3y) | 0.33 0.19 0.38 | 0.34 0.29 0.44 | |
| 12 terms poly (xy3) | 0.33 0.17 0.37 | 0.34 0.30 0.35 | |
| 13 terms poly (x4) | 0.34 0.17 0.38 | 0.36 0.31 0.48 | |
| 14 terms poly (x2y2) | 0.32 0.16 0.36 | 0.32 0.31 0.45 | |
| 15 terms poly (y4) | 0.34 0.16 0.37 | 0.37 0.32 0.46 | |
|
| |||
| Rmse at control (pixel) |
Rmse at check (pixel) | ||
| Transformation | X Y Vec | X Y Vec | |
| Linear conformal | 0.80 0.75 1.09 | 0.71 0.71 1.00 | |
| Affine | 0.60 0.54 0.81 | 0.53 0.36 0.64 | |
| 4 terms poly (xy) | 0.55 0.38 0.67 | 0.41 0.24 0.48 | |
| 5 terms poly (x2) | 0.56 0.38 0.68 | 0.42 0.24 0.48 | |
| 6 terms poly (y2) | 0.59 0.36 0.66 | 0.42 0.28 0.50 | |
| 7 terms poly (x2y) | 0.60 0.38 0.70 | 0.42 0.28 0.51 | |
| 8 terms poly (xy2) | 0.59 0.39 0.71 | 0.49 0.26 0.55 | |
| 9 terms poly (x3) | 0.32 0.39 0.51 | 0.25 0.25 0.35 | |
| 10 terms poly (y3) | 0.31 0.40 0.51 | 0.25 0.26 0.35 | |
| 11 terms poly (x3y) | 0.31 0.41 0.52 | 0.25 0.25 0.34 | |
| 12 terms poly (xy3) | 0.31 0.44 0.53 | 0.24 0.26 0.35 | |
| 13 terms poly (x4) | 0.32 0.44 0.54 | 0.25 0.25 0.34 | |
| 14 terms poly (x2y2) | 0.33 0.46 0.56 | 0.24 0.25 0.34 | |
| 15 terms poly (y4) | 0.34 0.40 0.53 | 0.25 0.25 0.34 | |
|
| |||
| Rmse at control (pixel) |
Rmse at check (pixel) | ||
| Transformation | X Y Vec | X Y Vec | |
| Linear conformal | 0.84 0.73 1.11 | 0.68 0.78 1.04 | |
| Affine | 0.48 0.32 0.58 | 0.35 0.35 0.50 | |
| 4 terms poly (xy) | 0.48 0.33 0.59 | 0.33 0.35 0.48 | |
| 5 terms poly (x2) | 0.45 0.31 0.54 | 0.29 0.32 0.44 | |
| 6 terms poly (y2) | 0.45 0.29 0.53 | 0.39 0.32 0.32 | |
| 7 terms poly (x2y) | 0.46 0.29 0.54 | 0.31 0.32 0.44 | |
| 8 terms poly (xy2) | 0.46 0.31 0.55 | 0.33 0.32 0.46 | |
| 9 terms poly (x3) | 0.41 0.31 0.52 | 0.35 0.32 0.47 | |
| 10 terms poly (y3) | 0.34 0.32 0.46 | 0.42 0.32 0.53 | |
| 11 terms poly (x3y) | 0.34 0.31 0.46 | 0.42 0.35 0.55 | |
| 12 terms poly (xy3) | 0.34 0.32 0.47 | 0.42 0.35 0.55 | |
| 13 terms poly (x4) | 0.35 0.33 0.48 | 0.42 0.36 0.56 | |
| 14 terms poly (x2y2) | 0.36 0.34 0.51 | 0.42 0.36 0.55 | |
| 15 terms poly (y4) | 0.36 0.32 0.48 | 0.40 0.40 0.56 | |
|
| |||
| Rmse at control (pixel) |
Rmse at check (pixel) | ||
| Transformation | X Y Vec | X Y Vec | |
| Linear conformal | 1.89 1.82 2.62 | 1.87 1.93 2.67 | |
| Affine | 0.58 0.33 0.67 | 0.42 0.35 0.64 | |
| 4 terms poly (xy) | 0.44 0.34 0.55 | 0.39 0.34 0.52 | |
| 5 terms poly (x2) | 0.44 0.35 0.56 | 0.40 0.34 0.53 | |
| 6 terms poly (y2) | 0.44 0.33 0.54 | 0.39 0.36 0.53 | |
| 7 terms poly (x2y) | 0.39 0.33 0.51 | 0.34 0.38 0.51 | |
| 8 terms poly (xy2) | 0.38 0.33 0.49 | 0.38 0.38 0.53 | |
| 9 terms poly (x3) | 0.29 0.33 0.45 | 0.34 0.40 0.53 | |
| 10 terms poly (y3) | 0.31 0.33 0.45 | 0.34 0.40 0.53 | |
| 11 terms poly (x3y) | 0.31 0.34 0.46 | 0.34 0.40 0.53 | |
| 12 terms poly (xy3) | 0.31 0.35 0.47 | 0.35 0.40 0.53 | |
| 13 terms poly (x4) | 0.32 0.36 0.48 | 0.36 0.40 0.53 | |
| 14 terms poly (x2y2) | 0.33 0.39 0.51 | 0.36 0.40 0.54 | |
| 15 terms poly (y4) | 0.33 0.33 0.47 | 0.36 0.46 0.59 | |
| Note : scanning at 600 dpi | |||
Conclusions and recommendation
The test carried out, through not comprehensive, have highlighted a number of points to be considered before a DTP scanner is used to scan aerial photographs. The points will be summarized as follows.
- Different DTP scanners have different distortions patterns and different magnitudes of image distortions.
- Different scanners of he same model (HP Scanjet 4c scanner) also have different pattern and magnitude of image distortion.
- Although the overall magnitude of image distortions in the some DTP scanners are almost the same size as the scanner optical resolution, the maximum resultant vector error at certain location within the scanned image is still significant.
- The introduction of a suitable mathematical model can help to reduce the effect of image distortions.
- Different orders of polynomial transformation are required for different scanners.
References
- Baltsavias, E. P., 1994a. Test and Calibration Procedures for Image Scanners. International Archive of Photogrammetry and Remote Sensing, vol. 30(1), pp. 163-170.
- Baltsavias, E. P., 1994b. The Agfa Horizon Scanner- Characteristics, Testing and Evaluation. International Archive of Photogrammetry and Remote Sensing, vol. 30 (1), pp. 171-179.
- Baltsavias, E. P., and R. Bill, 1994. Scanner - A Survey of Current Technology and Future Needs. International Archive of Photogrammetry and Remote Sensing, vol. 30 (1), pp. 130-143.
- Carstensen, L. W., and J. B. Campbell, 1991. Desktop Scanning for Cartographic Digitisation and Spatial Analysis. Photogrammetric Engineering and Remote Sensing, vol. 57(11), pp. 1437-1446.
- Finch, P. and D. Miller, 1994. A model of DEM and Ortho-image Quality for Aerial Photography. European Conference on Geographical Information System (EGIS), pp. 263-270.
- Gagnon, P. A., J. -P. Agnard, C. Nolette, and M. Baulianne, 1990. A Microcomputer Based General Photogrammetric System. Photogrammetric Engineering and Remote Sensing, vol. 56(1), pp. 623-625.
- Sarjakoski, T., 1992. Suitability of the Sharp JX-600 Desktop Scanner in Digitising of Aerial Colour Photographs. International Archives of Photogrammetry and Remote Sensing, vol. 29(1), pp. 79-86.