| GISdevelopment.net ---> AARS ---> ACRS 1997 ---> Poster Session R |
Estimation of Soil Erosion
using USLE and Landsat TM in Pakistan
Shigeo Ogawa, Genya Saito,
Nobuyuki Mino, Satoshi Uchida*, Nasir M. Khan**, and Muhammad
Shafiq**
National Institute of Agro-environment Sciences
3-1-3, Kannondai, Tsukuba, Ibaraki 305, Japan
Tel : (81)-298-38-8225 Fax : (81)-298-38-8199
E-mail : sogawa@niaes.affrc.go.jp
*Japan International Research Center for Agricultural Sciences
**National Agricultural Research Center
Abstract National Institute of Agro-environment Sciences
3-1-3, Kannondai, Tsukuba, Ibaraki 305, Japan
Tel : (81)-298-38-8225 Fax : (81)-298-38-8199
E-mail : sogawa@niaes.affrc.go.jp
*Japan International Research Center for Agricultural Sciences
**National Agricultural Research Center
The target area (Pothwar tract) is located in the northern part of Pakistan. The agriclture in the area is predominantly dependent upon rainfall. About 60% of the mean annual rainfall occurs during the summer season as high intensity storms. Soil erosion occurs during the season by storms. But it is not easy to estimate the quantity of soil erosion in the wide area.
Universal Soil Loss Equation (USLE) has also been employed as a basis to observe the intensity of erosion using Landsat TM, rainfall data, topographic map land capacity map. The results in this case could be improved by using more accurate data and through field ground survey. Heavily eroded is occurred at bare soil and steep condition. Low eroded area is mainly field. Erosion is occurred in summer season. This method is useful for detection of land use change and environmental change.
Introduction
The land degradation is not mainly due to soil erosion, water logging and salinity but primarily due to inappropriate use of the two main natural resources (land and water). Resource use planning and management is a complex and a comprehensive exercise, based on complete and regular monitoring information system for area. Thus it is important understand the existing state of resources, their extent of degradation and potential for phase-wise improvement of environmentally sensitive areas. Traditional sources of investigation are expensive and time consuming. At the same time, federal agencies continue to incur cutback of budget, manpower and other resources while continuing to be responsible using USLE. Several studies have indicated that remote sensing data and Geographic Information Systems (GIS) can be used as a first stage input to identify and map the degraded lands (Stephen et al., 1981; FAO 1978; Evangelista et al., 1992; Rondal and Yoshida., 1992 and Uchida et al., 1994).
Study Area
The area selected for this study in the small part of this plateau near the North-east of Fatehjang between latitude 33 30' to 33 45' and longitude 72 30' to 72 45' covering an area of about 27,500m X 23, 000 m (figure 1). The elevation ranges from 300m to 500m. The mean annual rainfall varies from less than 300 mm to more than 1000 mm. The mean seasonal rainfall varies from 300 mm to 500 mm in summer (Kharif) and 250 mm to 300 mm in winter (Rabi). The dominant crops are wheat in the Rabi season; and sorghum and maize in the Kharif season depending upon the rainfall pattern. Crop calendar (two years two crops) is shown as figure 2. The general soil types consist of loamy eroded loess and shallow residual with some gulled lands. Outcrops of lime stones can also be found in the hilly areas. The land is partially cultivated while the rest is covered with thin and scattered vegetation.
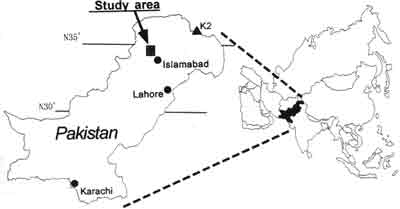
Figure 1 Showing study area location
Figure 2 Cropping calendar on Pothwar area (two years two crops)
Materials and methods
In this case study attempts have been made to monitor land cover distribution and evaluation of land degradation/erosion conditions using remote sensing and GIS techniques. Using data and methods are showed in figure 3 and as follows. The USLE is an empirically based model developed in the United States by using data on soil erosion rates. This equation has certain limitations but still is the best available method which is used most widely for estimating soil losses as average annual mass per unit area as a function of the major factors affecting sheet and rill erosion. It is showed as follows:
Where, E: average annual soil loss (tones/ha/year), R: rainfall runoff erodibility factor, K : soil erodibility factor, L : slope length factor, S : slope steepness factor, C: land cover and management factor, P : erosion control practice factor.
| E: Soil loss(ton/ha/year) | L: Slope length factor |
| R: Rainfall erodivity factor | S: Slope steepness factor |
| K: Soil erodivity factor | C: Cover and management factor |
| P: Erosion control practice factor |
Figure 3 Analysis flow of USLE model using RS & GIS
Rainfall factor (R ) is calculated as the product of storm kinetic energy time the maximum 30-minute storm depth (I30) and summed for all storms in a year. Rainfall was measured by test site locations to 10 km from study area and R was calculated from I30 and summed in monsoon season and non-monsoon (table 1). Soil erodibility factor (K) is a measure of the inherent erodibility of a given soil under the standard condition of the unit USLE plot maintained in continuous fallow. But, K value is not measured in Pakistan. We estimated K from table 2, table 3 and land capacity map. Almost soil types are categorized to moderate erodibility values (K = 0.3). Slope length factor (L) and slope steepness factor (S) are generally calculated the equation as follows:
where, S: slope steepness (%), L : slope length (m), m: m = 0.5. L is possible to calculate from Digital Topographic Model (DTM). But, it is impossible that the slope is continuous or no. If slope length is calculated from DTM. But, it is impossible that the slope is continuous or no. If slope length is calculated from DTM, it is sometimes very long. In this study, the slope length was fixed as 22.13 m. This value means the length of test field to decide soil erodibility factor. Slope steepness was calculated from DTM for each pixel. DTM was made from map (1/50,000) using ARC/INFO. Land cover and management factor (c ) was decided from land classification map and table 4. Land classification map was created from Landsat Thematic Mapper (TM) data acquired on 9 February 1992 by supervised classification using most likelihood methods. Erosion control practice factor (P) was decided from land classification map and table 5.
| Parameters | 1989 | 1990 | 1991 | 1992 | 1993 | 1994 | Mean |
| (Monsoon) | |||||||
| Total Raifall (mm) | 388 | 771 | 468 | 522 | 332 | 588 | 511.5 |
| Proportion of yearly Rainfall (%) | 74 | 64 | 74 | 67 | 66 | 76 | 70.2 |
| Max. per day (mm) | 69 | 153 | 42 | 105 | 67 | 90 | 87.7 |
| Min. per day (mm) | 2 | 1 | 5 | 5 | 3 | 2 | 3.0 |
| Rainfall events | 19 | 25 | 21 | 14 | 16 | 22 | 19.5 |
| Max. l30 (mm/hr) | 100 | 92 | 52 | 70 | 80 | 70 | 77.3 |
| Min. I30 (mm/hr) | 3 | 2 | 4 | 6 | 2 | 4 | 3.5 |
| Raifall events > 25 mm | 5 | 11 | 9 | 6 | 5 | 9 | 7.5 |
| Seasonal total EI30 | 572 | 947 | 277 | 484 | 415 | 546 | 540.2 |
| (Non Monsoon) | |||||||
| Total Raifall (mm) | 137 | 426 | 167 | 261 | 172 | 188 | 225.2 |
| Proportion of yearly raifall (%) | 26 | 36 | 26 | 33 | 34 | 24 | 29.8 |
| Max. per day (mm) | 30 | 51 | 44 | 53 | 31 | 22 | 38.5 |
| Min. per day (mm) | 2 | 2 | 1 | 3 | 2 | 2 | 2.0 |
| Rainfall events | 22 | 25 | 14 | 16 | 16 | 20 | 18.8 |
| Max. I30 (mm/hr) | 26 | 70 | 26 | 42 | 36 | 18 | 36.3 |
| Min. I30 (mm/hr) | 4 | 4 | 2 | 4 | 2 | 2 | 3.0 |
| Raifall events > 25mm | - | 6 | 1 | 3 | 2 | - | 3.0 |
| Seasonal Total EI30 | 84 | 216 | 45 | 77 | 57 | 35 | 85.7 |
| Soil characteristics | division | points |
| Soil human (%) | <2 | 4 |
| 2-5 | 3 | |
| 5-10 | 2 | |
| >10 | 1 | |
| Soil contents (%) | >50 | 4 |
| 30-50 | 3 | |
| 15-30 | 2 | |
| <15 | 1 | |
| soil structure | blocky, planty or massive | 3 |
| medium to coarse granular | 2 | |
| crumb or fine granular | 1 | |
| permeability | slow to very slow | 3 |
| moderate | 2 | |
| repid to very rapid | 1 |
| Total points | division | extent of K | Mean of K |
| >5 | Very low | <0.10 | 0.05 |
| 6-8 | Low | 0.10-1.20 | 0.15 |
| 9-11 | Moderate | 0.20-0.40 | 0.30 |
| <11 | High | >0.40 | 0.45 |
| Ministry of Forestry
(Indonesia): Handbook for the Preparation of Land Data Base Forms for Regional Planning | |||
| Land use class | Average C factor |
| 1. Primarily forest* (canopy cover >40%) |
0.002 |
| 2. Secondary forest** (canopy cover 10-40%) |
0.006 |
| 3. Shrub* | 0.014 |
| 4. Agricultural land** | 0.377 |
| 5. Grazing land** | 0.11 |
| source *Adapted from
Wischmeier and Smith (1978) ** Calculation from Morgan (1986) | |
| Land use type | slope( %) | P factor |
| Agricultural land | 0-5 | 0.11 |
| 5-10 | 0.12 | |
| 10-20 | 0.14 | |
| 20-30 | 0.19 | |
| 30-50 | 0.25 | |
| 50-100 | 0.33 | |
| Other land | all | 1.00 |
| source: based on interpolation from Wischmeier and Smith (1978) | ||
Results and discussion
Land cover was classified to 20 sub classes and finally combined to 7 classes. Classes are water, shadow, bare soil 1, bare soil 2, fallow, crop and forest. Class water means pond and river. Class bare soil 1 means bare soil of high reflectance. Class bare soil 2 means gully area. Class crop means wheat
According to analysis flow of figure 3, soil loss map was created in monsoon and non-monsoon season. Heavy rainfall is gathered in monsoon season, for example, rainfall factor in monsoon season is about six times.
Histogram of soil loss show in figure 4, soil loss from 0 to 10 ton/ha occupy 70%. Soil loss is lower than tropical area. According to analysis of north Thailand using USLE, soil loss show 6 level (0-20, 21-50, 51-100, more than 100 ton/ha/year).
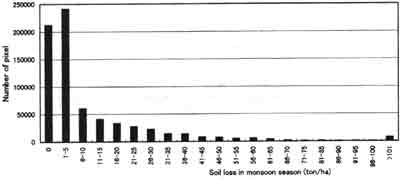
Figure 4 Histogram of soil loss
Histogram of soil loss of each land classification (figure 5), forest, crop field and fallow are very low. Fields are safety, soil loss of bare soil 1 is higher, soil loss of bare soil 2 is highest. Though it is a low rainfall, bare soil area is occurred the soil loss and degradation is progressing in this area. Especially, gully is occurred in these area from the field survey.
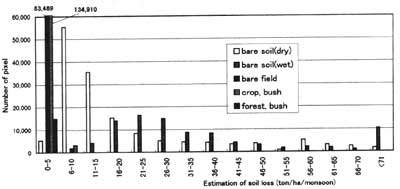
Figure 5 Histogram of class
In this study, slope-length is fixed to 22.13m. The relationship among LS, slope length and steepness is shown in figure 6. When L is from 20 to 40m, coefficient of LS is almost same value. But when L = 100 m, LS is about 1.5 times than L = 22.13m. When L is over 100 or less than 100m, coefficient of LS is different from value of definition.
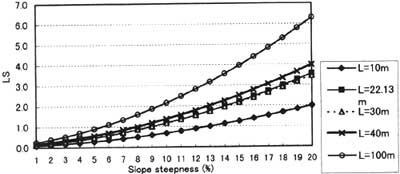
Figure 6 relationship among LS, slope length and steepness
This method is not verified by real data . But, it is useful to realize erosion estimation in wide area. Especially it is impossible to simulate the change of erosion by change of land use or conservation condition.
References
- Evangelista, Ma. A. M., J.D. Rondal, M. Yoshida (1992): "Methodology for vegetation degradation analysis using remote sensing: SCAN study of Mt. Pinatubo." In proceedings of seminar on satellite remote sensing and geographic information systems in agricultural research, IIRI, Los Banos, Laguna, Philippines.
- Food and Agriculture Organization (1978): "The application of Landsat Imagery to soil degradation mapping at 1:50,000", FAO Summary report.
- Global Resource Information Database (1991):" An analysis of deforestation and associated environmental hazards in northern Thailand - Studies on deforestation and soil loss-", Applications of remote sensing in Asia and Oceania, 3-5, AARS, 100-109.
- Stephen, P.R., D.K. Hicks and N. A. Trustrum (1981),"Aerial photographic technique for soil conservation research.", Photogrammetric engineering and remote sensing, 47(1), 78-79.
- Uchida, S.,R. Roochi and S. Ahmad (1994): "Land degradation analysis of rainfed agricultural area in Pakistan using remote sensing data.", In Proceedings of the 15th Asian Conference on remote sensing, Bangalore, India, 1, 4.1-4.5.