| GISdevelopment.net ---> AARS ---> ACRS 1997 ---> Poster Session R |
A Monitoring Method of Land
Cover/Land Use Change in Naiman, Inner Mongolia Autonomous Region, China
Using Landsat Data
Toshiaki Imagawa, Michikazu
Fukuhara, Wang Tao and Zhu Zhenda
National Institute of Agro-Environmental Sciences,
Ministry Agriculture, Forestry & Fisheries
3-1-1, Kan-nondai, Tsukuba-Shi Ibraki 305, Japan
Tel : (81)-298-38-8277 Fax : (81)-298-38-8199.
E-mail : imaga@niaes.affrc.go.jp
Abstract National Institute of Agro-Environmental Sciences,
Ministry Agriculture, Forestry & Fisheries
3-1-1, Kan-nondai, Tsukuba-Shi Ibraki 305, Japan
Tel : (81)-298-38-8277 Fax : (81)-298-38-8199.
E-mail : imaga@niaes.affrc.go.jp
Nariman Qi is located on the eastern edge of the Horqin desert and has recently experienced desertification. The desertification has progressed due to overgrazing and overcutting and fixed sand dunes began to move again in this area. In this study, we intended to develop a monitoring method of land cover/land use changes using Landsat data in order to analyze the progression of desertification. First, we were able to define the area that underwent desertification (hereafter referred to us "desertified area") using the following 3 indices; vegetation [TM 4 - TM 3)/ (TM 4 + TM 3], structure [TM 5- TM 1) /(TM 5 + TM 1)], and redness [TM 3 - TM 1) / (TM 3 + TM 1)]. We determined the yearly changes by superimposing the desertified areas identified based on data from different years. Second, we developed a monitoring method of land/cover use changes to analyze the changes to analyze the changes in the desertified areas. These methods enabled us to obtain basic information for clarifying the desertification processes.
Introduction
The term "desertification" in its technical sense has a broader meaning than simply describing the phenomenon occurring in peripheral areas of deserts. Therefore, "desertification" has been redefined in Agenda 21 as "land degradation in arid, semi-arid and dry subhumid areas resulting from various factors, including climatic variations and human activities". The term "desertification" is clearly used now to refer not only to areas surrounding deserts, but also to major food-producing areas in semi-arid and subhumid areas.
Even in East Asia, where the arid areas are not extensive, we can see that the new definition brings this problem closer to home. In particular, in eastern China, which accounts for 50% of the land and over 90% of the population of that country, climatic conditions are changing from the semi-arid regions in the north to the subtropical, subhumid areas in the south. Zhu et al. 1) estimated that desertification in China was induced by water and wind erosion, affecting 1.483 million km2 or about 15% of the land area of China.
The purpose of this study was to develop a monitoring method of land cover/land use changes using Landsat data in order to analyze the progression of desertification.
Some characteristics of desertification in Naiman
Naiman is located about 400 km NE of Beijing (Fig. 1). This semi-arid region has an annual average rainfall of 372 mm and annual average temperature of 6.4°C. Lacustrine sediments in the Quaternary are the main surface layer deposits in this region, and widely distributed sand dunes, formed in an earlier dry period, have been fixed and become covered by soil and vegetation along with the humidification of the climate. On fixed sand dunes and in the lowlands between dunes, field crops are grown, especially corn and sorghum. In addition, the grasslands in northeastern Naiman have been extensively developed.
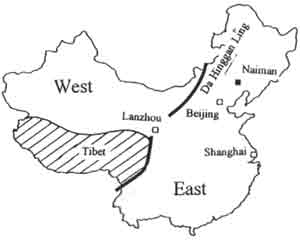
Figure 1: Study area
Desertification has been caused by the destruction of the natural vegetation and about 1-2 m of topsoil, and begins with the movement of unconsolidated sand. In this region, a strong wind of 5 m/s (18 km/h) often blows the sand around in the spring. Landsat images have revealed wave-like patterns on the ground surface facing the dominant wind direction, with widely distributed and dunes extending from west to east. The movement of sand is inversely related to the particle size, i.e. the smaller the sand particle the greater the magnitude of movement, and annual dune movement of 5 m/yr has been observed. Furthermore, in the grassland sections we can identify points where the sand has been expanding in elliptical patterns around ponds. At present, measure have been implemented to stop the movement of sand, and there are locations in peripheral areas where vegetation has invaded.
An extraction method of land cover changes
At first, we attempted to monitor the desertification process through land cover changes using Landsat data, and we identified decertifying regions by the following methods:
First, a vegetation index was used to identify unvegetated regions.
For Landsat MSS data (MSS 7 - MSS 5) / (MSS 7 + MSS 5)
Low values of this index represented unvegetated areas. Comparisons were made with composite images to derive the threshold, then unvegetated areas were identified. In addition, to consider seasonal in vegetation, we used autumn and spring data and common areas were identified.
Second, water bodies and non-made structures such as settlements, which were included in the non-vegetated regions, had to be removed. Fro that purpose, the ratio, (TM 5-TM 1)/ (TM 5 + TM 1), was obtained. Since bare land value in this band ratio was higher than that of water bodies and non-made structure, it was possible to separate the two. Therefore, the index derived from this ratio was designated as the structure index. Since there was no MSS sensor corresponding to the TM band 5, old data, were masked by water bodies and non-made structures derived from the new images.
Third, using the redness index (TM 3 - TM 1) / (TM 3 + TM 1) which reflects the amount of oxidized iron contained in the ground, desert areas were identified by the ground color in each region.
Finally, desertified areas identified based on data from different years were superimposed to obtain yearly changes.
Next, we verified the application of this method in the model district of Naiman A 30 km2 section was selected as the model district, and was analyzed for desertification patterns over the last 10 years. Decertifying regions have low vegetation indices. White-colored areas corresponding to the soil color of these areas were identified and the results from analysis of old and new images were superimposed to analyze the changes (Fig. 2).
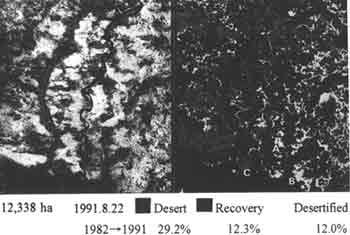
Fig. 2 Composite photo of Landsat TM (left) and recent trend of desertification (right) in Naiman
The areal proportions of the 3 model districts undergoing desertification were roughly 40%. However, the area of reclaimed land and the area of newly decertifying land were roughly 12% in the districts. This fact indicated that the areal extent of desertification was almost constant.
In Naiman, the areas around the settlements and around the N-S-running road and railway in the eastern part of the town showed some recovery from 1982-1991, in contrast to outlying areas, where desertification continued.
The above results indicated that desertification does not proceed unilaterally regardless of the state of degradation; rather, due to some of the measures implemented the progressing of desertification could be contained.
Extraction methods by land use classification
When we extract desertified areas using Landsat data, the most precise method is to define the desertified areas and land use types based on existing maps and field surveys. Therefore, we examined the land use classification in a test area in Naiman using land use units of the desertification map of Naiman Qi. These units contained active dunes, grassland, cropland, forest, wetland, villages and water bodies.
First, in the test area we set up about 5 typical points of each unit where changes had not been recorded since the publication of the map. Second, we checked the reflectance of every point using Landsat data observed at 5 different times from May to September 1992. Fig 3 shows an example of the results. Some characteristics are summarized as follows. Active dune showed the highest reflectance compared with other units through bands and time. In contrast, water bodies showed the lowest reflectance on both 4th and 5th bands, which belong to the near infrared region, through bands and time. Therefore, active dune and water bodies can be easily distinguished from other units using only one datum for the above reasons.
Fig. 3 Seasonal changes in spectral reflectance of each land cover/land use type
We could separate the other units using 2 data of late May and late July, since the vegetation of cropland and grassland was poor and the forest area had already been covered with green leaves in late May.
Moreover, the density of vegetation of cropland was higher than that of grassland in late July. These phenomena indicate the difficulty in classification into cropland, forest and grassland by using only one image. However this problem could be solved by using 2 different images observed in spring and summer, because in late May cropland and grassland are almost bare before seeding and trees are covered with fresh green, while in late July and August cropland and grassland are covered with green and cropland has a higher density then grassland. These changes reflect the value of the red band which is 3rd and in TM and displays a high reflectance against the photosynthetic pigment chlorophyll.
In this study, we used fine band data of Landsat TM for classifying land use as shown below; namely the 3rd band on May 20 and 1st, 3rd, 4th and 5th bands on July 23. We selected the locations where we checked the reflection of each land use type as training areas and classified these types with supervised classification (Fig. 4). As a result there was a high probability of accuracy in the classification (Table 1). Each unit was discriminated from the other units with more than 80% of probability. Especially, cropland and grassland were discriminated with 95% of probability. As mentioned above, we confirmed that this method was useful for land use classification. If each year we classify the land use in the same area and compare the results, we will be able to obtain desertification trends along with data related to reclamation, amount of cropland, clearing and plantation of trees.
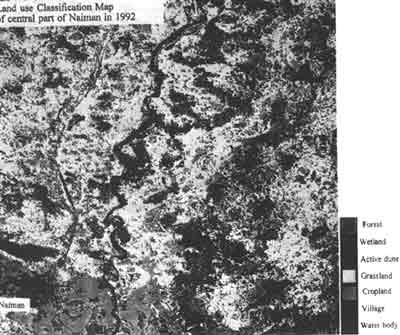
Fig. 4 Land cover/land use map classified by Landsat TM
Conclusion
Desertification in Naiman was characterized by the reactivation of fixed sand dunes. In this study, we developed a monitoring method of land cover/land use changes using Landsat data in order to analyze the progression of desertification.
| Active dune | Grassland | Cropland | Forest | Wetland | Village | Water body | |
| Active dune | 96.87 | 1.25 | 0 | 0 | 0 | 0 | 0 |
| Grassland | 0.29 | 94.71 | 0.29 | 1.14 | 0.86 | 1.29 | 0 |
| Cropland | 0 | 2.82 | 94.86 | 0.91 | 0 | 0 | 0 |
| Forest | 0 | 4.51 | 0 | 80.56 | 12.85 | 1.04 | 0 |
| Wetland | 0 | 2.50 | 0 | 6.75 | 81.25 | 2.50 | 5.75 |
| Village | 0 | 0.54 | 0.18 | 2.06 | 8.04 | 86.03 | 0 |
| Water body | 0 | 0 | 0 | 0.61 | 2.74 | 0 | 95.43 |
At first, we examined a monitoring method of land cover changes by using 3 indices; natural vegetation, structures, and soil redness. These indices were very useful to analyze the conditions and trends of desertification. We confirmed that no significant changes in areal extent pf desertification occurred in the model district. Land management around major settlements, roads, railway lines, etc ., was relatively meticulous and desert land was being re claimed. Conversely, in outlying regions new desert land appeared. As described above, we were able to analyze the conditions and trends of desertification by this method. However, we could not determine the changes in desertified areas by applying only this method.
Next, we developed a monitoring method of land cover/land use change based on supervised classification. This method which requires data at 2 different times in the same year, should enable to analyze the changes of land cover/land use in each pixel. In the present study we indicated the possibility of application of this method. And in the near future, we expect to be able to collect data.
Acknowledgement
The authors express many thanks to Prof. Liu Xin Min and Prof. Zao Halin, Institute of Desert Research, Chinese Academy of Sciences, for many helpful suggestions and their help in our field works. Landsat data were owned by the United States Government and supplied by EOSAT/NASDA.
Reference
- Zhu, Z. et al (1992): China : Desertification mapping and desert reclamation Form "World atlas of desertification" UNEP, 46-49