| GISdevelopment.net ---> AARS ---> ACRS 1997 ---> Poster Session 3 |
Classification of Sand dunes
Using JERS-1 Data for Petroleum Exploration in the Eastern Junggar Basin,
People's Republic of China
Masataka Ochi1,
Minoru Hatanaka2 and Yuichi
Maruyama3
1Nikko Exploration & Development Co., Ltd.
2-7-10, Toranomon, Minato-Ku Tokyo 105, Japan
Tel: (81)-3-3503-7781 Fax : (81)-3-3508-9785
2Japan Energy Development Co., Ltd.
2-10-1, Toranomon, Minato-Ku Tokyo 105, Japan
Tel : (81)-3-5573-6850 Fax : (81)-3-5573-6860
2Earth Remote Sensing Data Analysis Center
3-12-1, Kachidoki, Chuo-Ku Tokyo 104, Japan
Tel : (81)-3-3533-9380 Fax: (81)-3-3533-9383
Abstract
1Nikko Exploration & Development Co., Ltd.
2-7-10, Toranomon, Minato-Ku Tokyo 105, Japan
Tel: (81)-3-3503-7781 Fax : (81)-3-3508-9785
2Japan Energy Development Co., Ltd.
2-10-1, Toranomon, Minato-Ku Tokyo 105, Japan
Tel : (81)-3-5573-6850 Fax : (81)-3-5573-6860
2Earth Remote Sensing Data Analysis Center
3-12-1, Kachidoki, Chuo-Ku Tokyo 104, Japan
Tel : (81)-3-3533-9380 Fax: (81)-3-3533-9383
This study focuses on the limitations and benefits of satellite images when scouting a desert area for seismic planning purposes. The area chosen for this study was the Eastern Junggar Basin, PRC. In order to understand the general features of a desert, the sand dunes were classified into 17 units, on the basis of their Type, Wavelength and Relief Energy. Furthermore, the Wavelength and Relief Energy ratio was defined and mapped as an index for planning purposes. Finally the entire study area was classified into your zones according to the most appropriate seismic sources and operational difficulties.
Introduction
When conduction a seismic survey in the desert area, operational constraints are mainly related to local topographic conditions. Therefore, in order to predict and minimize problems, it is of crucial importance t investigate and analyze all the relevant data available and create a base map, before intensively planning the logistical approach, line location and selecting a method.
Where geography and geology have never been detailed due to the difficult access yet, satellite images provide significant clues for detecting and mapping exposed features as well as monitoring these features over the seasons.
In 1995, Japan Energy Development Co., Ltd., due to the interest in the logistical application of remote sensing technology over areas of complicated topography, and in order to understand the limitations and benefits of a satellite data when scouting a desert area, carried out a research project in the Eastern Junggar Basin, PRC (Figure 1). The project was conducted on behalf of the Earth Remote Sensing Data Analysis Center , Japan and with their support.

Figure 1. Location Map of the Study Area.
Geographical and Geological Settings
The Junggar Basin is an interior basin in the north Xinjiang Uygut Autonomous Region, PRC, which was formed among three mountain ranges called the Altai Shan, Tien Shan and Tarbagatay Shan. The surface of the basin is gently down-dipping from northeast to southwest and the elevation ranges from 250 to 1,000 m. Major geomorphologic features appearing in and around the study area are (1) alluvial plains along north piedmont of the Tien Shan, (2) plays lakes and moors, formed by the convergent drainage system in the western part of the basin and (3) the Gurbantunggut Desert, which covers the central part of the basin.
Two major outcrop belts are located in the northeastern and southern parts of the study area and they respectively are called the Kelameili Shan and Bogda Shan (Figure 1). The former consists of the Silurian to Creataceous sedimentary rocks. The Silurian to Permian generally extends in the E-W strike, while the Triassic and Jurassic form a gentle anticline with an axis of the N-S direction. The letter, on the other hand, is underlain mainly by the Carboniferous, Permian and Jurassic sedimentary rocks, which generally strike in the E-W direction. The Upper Permian of the Bogda Shan includes the thick oil shale sequences and they are thought to take part in the most significant source rocks for hydrocarbon accumulation. Several oil fields represented by the Houshaoshan and Cainan have been discovered in the study area since 1983.
Satellite Imagine Data Used
In this study, a total of 12 JERS-1 OPS images, mostly acquired in the summer of 1993, were photogeologically interpreted. Image processing involves contrast stretching of Level-2 image and false color assignment of BGR= 123 to produce full color images on a scale of 1:200,000.
Classification of Sand Dunes
Sand dunes in the Junggar Basin show a variety of styles and their movement has been restricted in areas where vegetation occurs. The vegetation has developed because of the high rate of precipitation in the area, approximately 150 to 200 mm annually. The sand dunes were classified using the following three morphologic and geometric features (Figure 2):
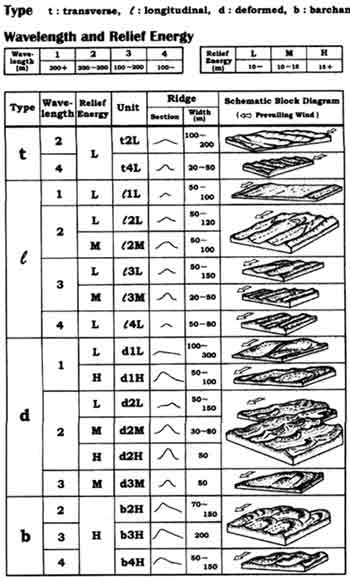
Figure 2. Integrated Classification of Sand Dunes.
| (1) Type | : transverse, longitudinal, deformed, barchan |
| (2) Wavelength | : 300 m+, 200~300 m, 100~ |
| (3) Relief Energy | : 100 m-, 10~15 m, 15 m+ |
The two former features, represented by their horizontal characteristics, were directly obtained from the JERS-1 OPS images, while the last feature was carefully interpreted and quantified, referring to and based upon an on-site observation of the dunes. By combining these features, sand dunes were classified into 17 units, as shown in Figures 2 and 3. The results of the classification appear to indicate that each unit and its dominated area can be related to some mechanism which forms the sand dunes.
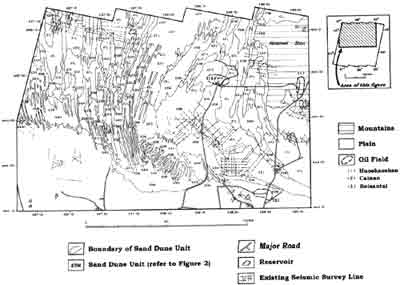
Figure 3. Classification Map of Sand Dunes in the Desert Area.
Discussion and Conclusions
It is indicated in Figure 3 that Unit 1L dominates in the southeastern and northwestern parts of the study area, while Units 3M, 3H and 4H are dominant in the central, northeastern and southwestern parts of the study area. This indicates that it would be easier to conduct a seismic operation in the southeastern and northwestern parts of the study area because the dune's wavelength is mainly long and their energy if low. It is predicated that in the areas covered by Units 3M, 3H and 4H, operation would be less efficient and the survey design and equipment would require changes.
Considering that the slope of the dune is one of the most important parameters as well as the classified units mentioned above, when planning transportation and operation, the ratio of Wavelength and Relief Energy was defined as Slope Index. This new index simply means that the smaller and the Slope Index, the gentler the slope and vice versa. For determination of Slope Index of each sand dune unit, the following expedient figures were adopted on the categories of Wavelength and Relief Energy, respectively.
| Wave-length (m) | 1 | 2 | 3 | 4 |
| 350 | 250 | 150 | 50 |
| Relief Energy (m) | L | M | H |
| 10 | 15 | 20 |
In order to create a base map, both an appropriate seismic source (vibrator or dynamic and the associated efficiency of operation were considered and plotted on the basis of the Slope Index. Practical considerations for selecting a seismic source is that, track-mounted vibrator is an efficient tool for flattened or very gentle slopping areas, while dynamite can be used all-around regardless of topography, but normally requires drilling operation which inevitably limits the daily production of shooting.
Based on the above discussion, the entire area of the study was classified into four zones as below and was mapped in Figure 4.
Figure 4. Classification Map of Sand for Seismic Survey Planning.
Va : Vibrator easily workable in the N-S direction (Slope Index = 0.03)
Vb : Vibrator workable in the N-S direction (Slope Index = 0.04)
Da : Dynamite source required, Zone of gentle and low relief energy (Slope Index = 0.06-0.08)
Db : Dynamite source required, Zone of steep slope and high relief energy. (Slope Index >0.10)
It is evident in Figure 4 that N-S lines between the dunes, would be much easier to shoot than E-W lines, as the former crosses fewer dunes than the latter. Furthermore, this base map provide information when deciding the location, direction and length of the lines, seismic source and ways to detour dunes for logistics.
Based upon the above satellite image interpretation as well as a field verification survey, the results conclude that remote sensing technology can provide a variety of information for seismic planning. Any knowledge obtained will make a great technical and economic impact on hydrocarbon resources exploration in untrodden areas.
Acknowledgments
The authors are grateful to Mr. Toru KAWAKAMI, General manager of the Department of Research and Development of the Earth Remote Sensing Data Analysis Center, for permission to present this paper. They also are much indebted to Mr. Li Da Zeng, Senior Engineer of the Geological Exploration Department of the Xinjiang Petroleum Administrative Bureau, who kindly provided technical support during the field verification survey, and Mr. Koji HAYASHI, General Manager of the Exploration Department of Japan Energy Development Co., Ltd., for critical reading of the manuscript.
References
- Carroll, A. R., Brassell, S. C. and Graham, S. A. (1992) : Upper Permian lacustrine oil shales, southern Junggar basin, northwest China, AAPG Bull. vol. 76, no. 12, p. 1874-1902.
- ERSDAC (1996) : JERS-1 data application for resources exploration in the eastern Junggar basin, People's Republic of China. in Report on search and development of remote sensing technology for non-renewable resources (in Japanese with English abstract).
- Mackeee, E. D. (1979) : Introduction to a study of global and seas. In McKee, E. D. ed, A study of global sand seas, U. S. Geol. Survey Prof. Paper, 1052, p. 1-21.