| GISdevelopment.net ---> AARS ---> ACRS 1997 ---> Poster Session 2 |
Use Of Satellite Data To
Estimate Areal Evapotranspiration From A Tropical Watershed
Amin, M.S.M1,
Amjad Nabi1 and Shattri
Mansor2
1Department of Biological and Agricultural Engineering
2Department of Civil engineering
faculty of engineering, University Putra Malaysia
43400, UPM Serdang, Selangor, Malaysia
E-mail:amin@eng.upm.edu.my
Abstract 1Department of Biological and Agricultural Engineering
2Department of Civil engineering
faculty of engineering, University Putra Malaysia
43400, UPM Serdang, Selangor, Malaysia
E-mail:amin@eng.upm.edu.my
A physically based scheme was used to model evapotranspiration (ET) from a tropical watershed using weather data satellite imagery. The land cover classes over the watershed were interpreted from Landsat TM imagery. The watershed was subdivided into hydologicallly homogeneous ground response units (GRUs). A geographic information system was used to integrate topographic, soils and vegetation data for each GRU. Leaf are index (LAI) as the most important vegetation structural variable was estimated form Landsat TM data. A simple form of LAI as a function of TM data was established. ET estimates were made over the whole year of 1993. the derived ET compared well with the other regional studies.
Introduction
The evapotranspiration (ET) is a key process controlling the exchange of energy and mas by vegetation. Forest hydrology studies suggest, the change in vegetation type and density re likely to alter ET significantly, and so does the eater yield ( Bosch and Hewlett, 1982 ). The role of vegetation in controlling energy and mass exchange rate from land surfaces depends on physiological characteristics of vegetation as well as climate ( Jarvis and McNaughton, 1986). In humid tropical regions, the substitution of tropical rain forest by agricultural crops and modify energy and mass exchange and alter atmospheric characteristics. In Malaysia generally, single species of trees such as Hevea, Oil Palm and Cocoa are used for afforestation. In particular, the water use of rain forests is of major interest on a local scale where a change of land use will affect nearly every water resources aspect. The aim of this study is the use of the remote sensing data s input to estimate and model ET and examining the relative magnitudes of watershed water budgets and input variables needed by the model that can be estimated from the satellite remote sensing data . the bernam River basin in the state of Perak, west Malaysia was chosen for this study where the recession of water resources since 1970's is the main impact of environmental changes in this regions ( Amin and Amjad, 1996).
Remote sensing provides the needed dynamic temporal view of vegetation, and complete spatial coverage. For this study Landsat TM data were used to identify the dominant categories of land cover characteristics and surfacial features of watershed to aid in partitioning of the watershed into ground respones units 9 GRUs) in conjunction with topographic data. Leaf are index ( LAI ) s an important structural variable to quantify energy and mass exchange of palnt canopies was also estimated from the TM data. A vegetation-indices based model was used to relate field measured LAI from different vegetation stands to vegetation index 9 NDVI) from the Landsat TM data. GIS applications are becoming popular in application of hydrologic modeling for parameter estimation and watershed partition. Data overlays were used in estimating selected model parameters such as vegetation type and density, and soil physical properties.
Area description and Climate
Trolak watershed covers 66 km2 of the north0east of Bernam River basin in the state of Perak. The topography is hilly ot mountainous country rising to heights of 1067 m ( a.m.s.i) in the north-east corner. The are is composed principally of sedimentary deposits. All soils are well drained. Textrual classes mostly lie between loam to clay with moderate to average soil moisture holding capacity. Most of the lowland is plantation of 15 to 25 year-old Oil palm and Hevea. On higher evaluations the dominant vegetation is dipterocarp forest. Phydically and hydro logically the Trolak watershed is typical hilly tropical watershed with 2794 mm average annual rainfall. The annual distribution of rainfall is influenced by the north-east and south-west monsoons. The rainfall is seasonally distributed with the maximum mean monthly rainfall of 339 mm occurring in November and the minimum of 149 mm in July. The temperature and humidity seasonal variation is little. Tj9e daily temperature varies form 180C to 360C and annual mean is 27.50C.
Evapotranspiration (ET) Modeling
A physical distributed modeling approach is used to model ET from tropical vegetated watershed using daily rainfall, and meterological data to adequately reflect the effects on ET of changes in vegetation, climate and soil moisture. For the purpose of this study, vegetation is broadly categorized as rainforest , plantation of Oil palm and Heva and mixed vegetation. The concept of division of the watershed into subunits ( GRUs) of homogeneous vegetation is used to provide capability of the distributed parameters. In order to compute average responses. Evaporation form vegetation canopy, and transpiration from plants re modeled separately and used to compute actual ET at the end of each day.
As a brief summary of the model function, canopy vegetation is treated as proportional to the LAI. Interception is computed as a reflection of LAI and evaporation form the canopy is limited by the potential radiation energy. Net rainfall is les an amount for intercepted rainfall is added to the ground surface where it is available for transpiration. The available potential radiation energy is used for evaporating canopy intercepted water and transpiration energy based on the LAI and the species dependent light extinction coefficient. Transpiration is compound using he Penman-Monteith ( PM) equation incorp9orating radiation and vapour pressure deficit drivers for evaporation, and linked with the soil moisture balance model to account of environmental variables. The humidity, temperature, and radiation correction are also done sequentially in computing canopy resistances, which in turn affects transpiration. Aerodynamic conductance was considered 0.2 ms-1 in the PM equation based on forest ET modeling experiments by calder et al., (1986) in this region. The values of light extinction coefficient ranging from 0.35 to 6 were used for Beers aw attenuation of incident radiation to produce canopy average radiation. Soil moisture model based on field capacity is considered. Soil moisture is updated at the end of each day after correcting for transpiration, infiltration, an drainage. As the completer modedl is rather large , it is not possible in this paper to cover all the equations used in the model.
The Data sets
Daily input data are rainfall, air temperature, humidity and insulation. The other required parameters reflected the physical characteristics of the watershed, including vegetation and soils description of the parameters and meterorological input data sets follow a brief explanation the watershed subdivided into GRUs and LAI estimation from the satellite data.
Land cover classification
The Landsat Tm data of February 26, 1993 were use together with aerial photographs, topographic, land use and soil maps for land cover classification. ERDAS software was used for the image processing and generating data overlays and vector data were stored and processed in ARC/INFO. The TM data were classified using an unsupervised clustering algorithm to identify the dominant categories of land cover characteristics of watershed. The image was classified into 6 spectral classes. These spectral classes were easily grouped into three broad informational classes namely forest, oil palm and Hevea. If two vegetation types were equally predominant in a GRU, a mixture of two was considered. Classified ground cover classes of Trolak are shen in figure 1, since the spatial extent of the study are is tool large to consider finer details like species variation, this scheme should be fairly reasonable. A vector image containing the watershed and subwatershed boundaries was overlaid on the classified image for the demarcation of tentative boundaries of GRUs based on the classified ground cover classes.
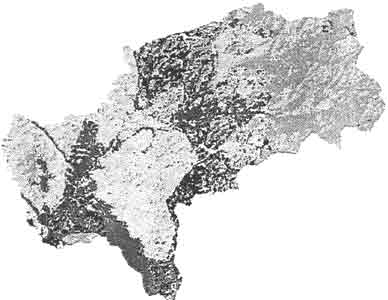
Figure 1: Classified ground cover classes of Trolak watershed
A GIS approach based on elevation, slope and aspect was used to subdivide the tentative GRUs with large elevation differences into smaller GRUs with relatively smaller elevation differences differenes into smaller GRUs with relatively smaller elevation difference. It was assumed that generally a GRU with relatively smaller elevation differences. It was assumed that generally a GRU will not have an elevation difference of greater than 300m. these GRUs were then overlaid on the raster containing vegetation type classes so as the verify the partitioned GRUs and to ensure that no modification is needed. However, some sample field data will be needed to ascertain as to what each ground cover class represent on the ground. The masked of these GRUs were used ot prepare different data layer for estimating model parameters and input variables of each GRU. The detailed procedure of raster/data preparation and watershed subdivision into GRUs is available in Amin et al. (1996).
Leaf area index (LAI)
In order to estimate LAI from TM data, a simple form of LAI as a function of TM data was established. A vegetation-indices 9VI) based model was used to relate 46 field measured LAI of 10 sites from forest oil palm and rubber stands to the vegetation index form the Landsat TM data. In this model, the LAI of three vegetation stands was defined as the dependent variable. Vegetation-Indices based mode is obtained by rearranging he Baret and Guyot (1991) model in which the vegetation index expressed s a function of LAI, using modified Beer's law. The detailed procedure of field assessment of LAI and relationship between the LAI measurements and the vegetation indices form Landsat TM data are available in Amjad and Amin (1997).
The meteorological data
The maximum and minimum temperature data were taken from Trolak Utara, the nearest weather station located about 6.5 km north of Trolak bridge and monthly lapse rates were determined using the data form Cameron Highlands. Daily rainfall was taken from Trolak, about 1 km north of Trolak bridge. Daily shortwave radiation was estimated on the slope-aspect combination of each GRU. The required inputs for the calculation are the latitude, the slope inclination and aspect, and the day of the year.
Results and Discussion
Model Parameter
Figure 2 shows 14 GRUs of the Trolak watershed which were used as units in the distributed modeling approach to estimate parameters and variables. Based on the assumption of hydrological similarity within a GRU, a single weighted average value of the given parameter is used for a GRU. The model parameters are categorized into vegetation, topographic, soil, hydrologic parameters and meteorologic parameters table 1 presents the values of these parameters for each GRU.
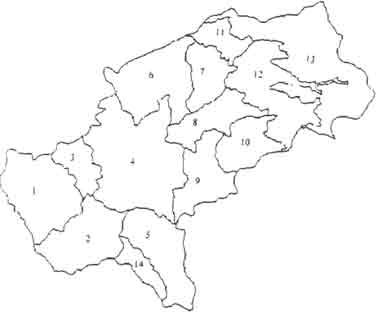
Figure 2: Ground response units (GRUs) of Trolak Watershed
| GRU# | 1 | 2 | 3 | 4 | 5 | 6 | 7 | 8 | 9 | 10 | 11 | 12 | 13 | 14 |
| Area ha | 618 | 501 | 200 | 1051 | 472 | 584 | 260 | 317 | 373 | 298 | 169 | 610 | 1009 | 133 |
| Elevation m | 114 | 123 | 103 | 111 | 136 | 173 | 275 | 185 | 141 | 232 | 577 | 613 | 935 | 153 |
| Vegetation | O | R,O | O,R | O | O,R | R | O,F | R,O | R | O,F | O,F | F | F | G |
| LAI | 3.56 | 3.01 | 2.72 | 3.65 | 3.4 | 3.66 | 3.83 | 2.81 | 3.35 | 3.84 | 3.92 | 4.45 | 4.42 | 0.27 |
| SMX mm/m | 125 | 143 | 132 | 138 | 147 | 152 | 124 | 109 | 155 | 123 | 114 | 114 | 114 | 121 |
| O,R,F, G=oil palm, rubber, forest, grassland; SMX=maximum available water holding capacity. | ||||||||||||||
Evaporation estimate
The cumulative estimated actual ET for the Trolak watershed for the year 1993 is approximately 1523 mm with 3002 mm rainfall. The transpiration component was 1025 mm, interception accounted for 498 mm. Figure 3 shows cumulative estimates of transpiration, interception and total evaporation . the mean daily transpiration rate was 2.8 mm day-1 and maximum mean daily estimated ET rate was 4.9 mm day-1 during the month of November, which seems reasonable for this area. In the absence of observed ET data, estimates were compared with average value of ET as reported for similar vegetation types to those found in Trolak watershed. The annual cumulative evaporation value fo 1523 mm is close tio the potential ERT value 1515 mm as estimated by Penman Method (DID, 1986). The mean daily transpiration rate and cumulative ET values are also close to calder et al., (1986) estimated values of 2.6 mm day -1 and 1481 mm respectively by PM equation with resistance term form the lowland humid tropic rainforest of West Java.
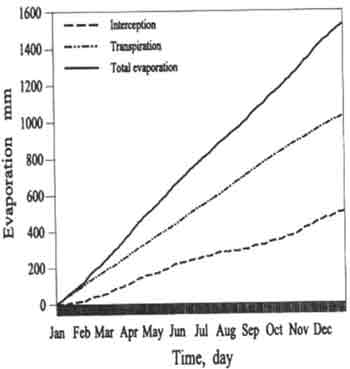
Figure 3: Cumulative estimated interception, transpiration and total evaporation of the Trolak watershed for the year 1993.
The energy required to evaporate the estimated annual evaporation of 1523 mm is 3.81e.+9J which is almost identical with the net radiation of 4.12e+9j calculated from the Angstrom equation inv9oking the ration of observed to maximum possible sunshine hours at this latitude. The Trolak site, rarely experiences soil moisture limitations and the maximum daily temperature always reaches the " Partition " temperature of 320C. under such conditions, virtually all net radiation is converted to latent heat ( Priestly, 1966; De Bruin , 1983) and total evaporation is almost equal to the water equivalent of net radiation.
The daily variations of estimated available soil moisture for the year 1993 are shown in figure 4. this figure also shows, the soil moisture peaks during high rainfall months where a significant quantity of soil water infiltration occurs. Thereafter, the soil moisture storage is being depleted by ET in dry months. The pattern of variation in soil moisture and the timing of peaks shoes a good estimate to the soil moisture model in the absence of soil moisture data .
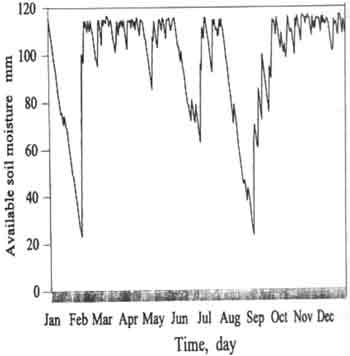
Figure 4: Estimated soil moisture of the Trolak watershed for the year 1993.
Conclusions The Landsat TM data classification and the LAI estimation of vegetation covers illustrate the potential values of satellite remote sensing data for the study of tropical vegetation canopy characteristics. a comparisons between model estimates and reported RT values of region shows that hydrologic model using satellite-derived data can achieve reasonable predictions. This study an example on the use of satellite data which can provide the basis for a hydrologic model form tropical vegetated watershed.
Reference:
- Amin, M.S.M. and N.Amjad. 1996. impact of environmental change on irrigation water reseoreces using remote sensing and GIS, In: procof the 16 the congress of Irrigation and Drainage, ICID, Cairo, Egypt, Vol 1D, 19-21.
- Amin, M.S.M. and N.Amjad and M.Shattri. 1996. land cover classification with remote sensing and GIS for Hydrological distributed modeling, In: proc. Of First Annual Malaysian Remote sensing & GIS conference. MRSS, , Kuala Lumlpur, Malaysia.
- Amjad, N.asnd M.S.M.Amin. 1997. use of Landsat TM data for leaf area index ( LAI) estimation in humid tropical plant canopies.( Submitted to Pertanike J.Sci. and Tech., UPM).
- Baret, F., and G.Guyot=. 1991., Potentials and limits of vegetation indices for LAI and APAR assessment. Remote sen. Environ., 35:161-173.
- Bosch, J.M., and J.D. Hewlett. 1982. a review of catchments experiment ot determine the effect of vegetation changes on water yield and evapotranspiration.. J.Hyfro., 55:3-23..
- Calder, I.R., I.R. Wright and D.Murdiyarso. 1986. a study of evaporaitn form tropical rain forest-west Java. J.Hydrol., 89:13-31.
- De Bruin, H.A.R.(1983). Evapotranspiration in humid tropical regions . Hydroligy of Humid tropical Regions with Particula Reference ot the Hydrological Effects of Agriculture and Forestry Practive. IAHS Publ. No 140: 299-311.
- DID, 1986. Sungai Tekam Experimental Basin Final Report. Water Resources Publication. Drainage and Irrigation Department, Kuala Lumpur.
- Jarvis, P.G., and K.G.McNaughton (11986). Stomatal control of transpiration scaling up from leaf of region, Adv. In ecol. Res., 15:1-49.
- Priestley, C.H.B. 1966. The limitation of temperature by evaporation in hot climates. Agric Meteorol., 3:242-246.