| GISdevelopment.net ---> AARS ---> ACRS 1997 ---> Poster Session 2 |
Automatic Cloud Cover
Assessment for SPOT Images
C.F.Chen, Y.S.Juang, and
A.J.Chen
Center for space and Remote sensing Research
National Central University
Chung-Li, Taiwan, R.O.C.
Tel : 886-3-4227151-7624, Fax: 886-3-4254908
E-mail:cfchen@csrsr.ncu.edu.tw
Abstract Center for space and Remote sensing Research
National Central University
Chung-Li, Taiwan, R.O.C.
Tel : 886-3-4227151-7624, Fax: 886-3-4254908
E-mail:cfchen@csrsr.ncu.edu.tw
The cloud cover of the earth resources satellite images, e.g Landsat and SPOT, has always been the great concern to the ground receiving station and the users. For the ground receiving stations, the cloud cover is recorded as being one of the major meta data in the images archive, while for the users, the cloud cover frequently represents the unwanted information of the images. In this study, an automatic algorithm is developed to assess SPOT image's cloud cover. The algorithm consists of two major stages; threshold segmentation, and post processing . in the first stage, a threshold-based filter is designed to find out the pixels that normally have greater spectral responses in the images . in the second stage, the post processing is used recover the remaining cloud pixels that have been excluded from the initial segmentation stage. Te proposed algorithm has been compared with the manual method. The results indicate that the proposed method is able to reach a comparable level qualitatively and quantitatively with the manual assessment.
Introduction
The first resources satellite receiving station in Taiwan has started receiving and processing data since 1993. a tremendous amount of remote sensing data has been received and widely used many applications in this country since then. For the images obtained from the optical sensors, e.g, Landsat and SPOT, the cloud cover has always been a great concern to the users. In order to help the users to identify the candidate images, the receiving station has developed an images catalog system which offers the quick-look images and their cloud cover percentage. At present, the cloud cover identification and percentage assessment are manually analyzed on the monitor screen. The routine practice shows that the manual identification is a labor-intensive and time -consuming task for the analyst. This study attempts to develop an automatic method to detect cloud location and calculate the cloud percentage in SPOT quick, look images. The method consists of two major stages: threshold segmentation, and post processing. In ht first stage, because the cloud has relatively high spectral response than other features in the image, a threshold-based filter using the spectral statistics ( mean and standard deviation ) of IR, Red, and Green bands of SPOT images is designed to divide the cloud pixels form other features ( Lillesand and kifer , 1995). The aim of the first stages is to make certain of the pixels identified are exclusively the cloud. In the second stage, the post processing is used to recover the remaining clouds excluded from the initial segmentation stage, and eliminate the misidentified cloud pixels. The procedures include the region growing (Rosenfeld and Kak, 1982) and the shape recognition (Pratt, 1991). The region growing is used to find more cloud pixels form the cloud boundary identified during the first stage. The shape recognition is aimed to eliminate highly reflective landscapes (e.g. rivers ) that the grouped as the cloud pixels in the region growing step. The detail method will be addressed in next section. The following section will present the testing results. Some conclusion remarks are given in the final section.
Method
The method if this study consists of two major steps : (1) threshold segmentation and (2) post processing .
- Threshold segmentation
the segmentation includes the design of a spectral threshold. The key 9ot select the threshold is based on the fact that the cloud pixels normally have higher spectra responses than other features in an image. in this study , the empirical tests suggest that the threshold can be selected as the image's mean pluses on e standard deviation. Therefore as long as the pixel has the value greater than the threshold, The pixel is considered as being the cloud pixel. Moreover, the empirical tests indicate that this threshold condition has to applied to SPOT's all three spectral bands in order to correctly locate the cloud pixels. The aim of this step is designed to rap only cloud pixels.
- The post-processing
the step is designed to ding out more cloud pixels that are excluded form the initial segmentation stage. The method used here is the region growing algorithm. The algorithm uses the cloud pixels located in the first stage as the seed pixels to grow around the neighboring area. Thus, based on a user-defined criteria, pixels with similar spectral values that are adjacent the seed pixels become the cloud pixels. Since the region growing process may include some highly reflective landscapes, most of them are the bare land of the river bank, it is necessary; to eliminate these non-cloud pixels . because the shapes of most of the sub-tropical clouds are different from the rivers which mostly present as the linear shapes in image, a linear shape template is used to move around the areas that have grown in the previous step. The pixels that have grown in a linear shape will then be eliminated.
Two SPOT quick-look images are selected from the catalog query system to test the proposed algorithms. The quick-look images with 512 by 512 pixels is resampled form the originally full scene, normally with the size about 5000 by 5000 pixels. The test results are shown in figure 1 and 2. the visual inspection indicates that most of the cloud pixels can be correctly located by the proposed algorithm. It also observes that the rivers are successfully excluded from the cloud pixels. Moreover he quantitative comparison with the operator's estimates demonstrates that over 90% accuracy for cloud cover assessment can be obtained with the proposed method.
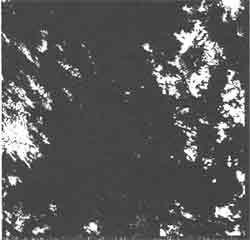
(a) SPOT image
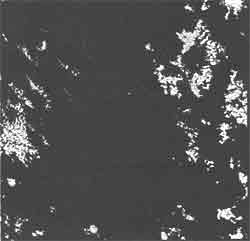
(b) Image with detected clouds
Figure 1. SPOT image and the image with detected clouds
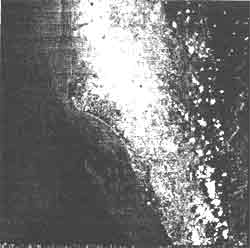
(a) SPOT image
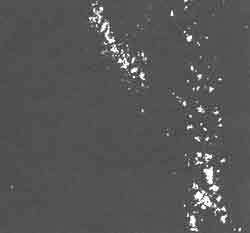
(b) Image with detected clouds
Figure 2. SPOT image and the image with detected clouds
Conclusion
The cloud cover of the optical satellite images has always been the great concern to the ground receiving stations and the users. This paper presents an automatic method to assess the cloud cover of SPOT images. The method employs the threshold segmentation and region growing algorithm to estimate the location and percentage of cloud cover. The visual inspection and numerical comparison demonstrate that the proposed method have potential to aid SPOT images users to assess the could cover automatically.
References
- Lillesand, T.M., and R.W.Kiefer, " Remote sensing and Image Interpretation ." 3rd edition, John Wiley & Sons, Inc, New York, N.Y.1995.
- Pratt, W.K., " Digital Image Processing ", 2nd Edition, John Willey & sons , 1991.
- Rosenfeld Azriel and Avinash C.Kak, " Kak Picture Processing", 2nd Edition Academic Press, 1982.