| GISdevelopment.net ---> AARS ---> ACRS 1997 ---> Poster Session 2 |
Integration of Remote Sensing
and GIS Techniques to Study the Relationship Between Vector Borne Disease
and Vegetation Cover: A Case of Malaria Chanthaburi Province of Thailand
Dr. Kaew
Nualchawee1 , Dr. Pratap Singhasivanon2 Dr.
Krongthong Thimasarn3, Dr. Darasri Dowreang4 Dr.
Kenneth Linthicum5, Ms. Ratana Sithiprasasna6 Mr.
P.L.Rajbhandari7
1Coordinator, Space Technology Applications and Research Program,
Asian Institute of Technology, Bangkok
2 Head, department of Tropical Hygiene,
faculty of Tropical Hygiene Mahidol University, Bangkok,
3 Director, Malaria Region V,
Department of Communicable Disease Control,
Ministry of Public Health, Nonthaburi, Thialand
4 Research Scientist, Remote Sensing Division,
National research Council of Thialand, Bangkok, Thailand
5Chief, Department of Entomology,
US Army Medical Component, AFRIMS, Bangkok, Thialand
6Medical Research Technologist, Department of Entomology,
US Army Medical Component, AFRIMS, Bangkok
7 Research Associate,
Space Technology Applications and Research Program,
Asian Institute of Technology, Bangkok, Thialand
Abstract 1Coordinator, Space Technology Applications and Research Program,
Asian Institute of Technology, Bangkok
2 Head, department of Tropical Hygiene,
faculty of Tropical Hygiene Mahidol University, Bangkok,
3 Director, Malaria Region V,
Department of Communicable Disease Control,
Ministry of Public Health, Nonthaburi, Thialand
4 Research Scientist, Remote Sensing Division,
National research Council of Thialand, Bangkok, Thailand
5Chief, Department of Entomology,
US Army Medical Component, AFRIMS, Bangkok, Thialand
6Medical Research Technologist, Department of Entomology,
US Army Medical Component, AFRIMS, Bangkok
7 Research Associate,
Space Technology Applications and Research Program,
Asian Institute of Technology, Bangkok, Thialand
An Epidemiological and ecological study had been conducted to determine the correlation between various factors contributing to malaria transmission. The vegetation cover is one factor that may affect malaria transmission. Entomological parameters of Anopheles virus related to malaria transmission and vegetation patterns were determined in malaria endemic areas located along the Thai-Cambodia borders using retrospective and prospective data. LANDSAT satellite imagery was used to produce a land cover map for 1995. Land cover changes between 1985, 1990 and 1995 were analyzed using a Geographic Information System(GIS). GIS is used as the Analysis tool to map parameters contributing to malaria transmission by creating overlays of epidemiological, entomological and environmental data on land cover data from different dates. Analysis of environmental factors related to malaria transmission were performed using correlation statistics on geo- coded data in the GIS. The results of this study show that there are changes in the incidence of malaria transmission and vegetation cover s between 1985, 1990 and 1995 in the study area. Many factors, including land cover class, affect malaria transmission. The working scale of he study area map also plays an important role for the study.
Introduction
Malaria remains one of the major public health problems in Thialand. After 40 years of national control program efforts, the mortality due to malaria has been greatly reduced from 350 per 100,000 populations in 1951 to 1.87 per 100,000 in 1992. This is in part due t the impact of improvement of health infrastructure and malaria clinic network. Although malaria morbidity has shown a downward trend, some fluctuations of malaria incidence have been observed. Factors such as parasite resistance to drugs, influence of political situation, population movement and environmental changes are found to be associated with changing of malaria incidence.
At present malaria transmission is concentrated along the mountainous, forest covered areas of the Thai-Cambodian border where movement between countries is extensive and the vegetation is largely forest (Fig.1). By contrast, in the central plain area which has been largely deforested, malaria has been eradicated for many years.
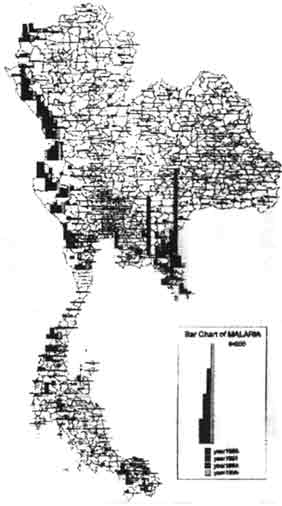
Fig.1 Distribution of malaria different parts of Thialand in different years.
The two main mosquito vectors are Anopheles virus and Anopheles minimus. Anopheles virus larvae are found in stagnant water in deep dense forests and rubber plantations, fruit orchards and some man made breeding places. This vector is prevalent along the Thai-Cambodian border. Anopheles minimus is present throughout the country and breeds in slow running streams in forests or forests fringes. This is a very important vector in areas of deforestation and changing vegetation cover to agricultural plantations (e.g. sugarcane, corn and cassava).
Entomological studies that were conducted in some of malaria endemic areas in Thailand found that changes in anopheline vector species composition, density and biology were attributable to environmental shifts (Rosenberg et. al. 1990). Malaria incidence is greatest in provinces located along the Burmese and Cambodian borders with forest cover greater cover greater than 35% of the area of the province based upon unsupervised vegetation classification schemes of NOAA/NDVI data.
Satellite Remote Sensing techniques have been recently used to monitor factors affecting disease transmission. Recent studies have demonstrated that satellite imagery, digitized land use maps and geographic information systems are promising for predicting changes in habitats of mosquito vectors (Hayes et. a. 1985)., and LANDSAT TM data, with a resolution of 30m, have been used to characterize immature habitats of flood-water mosquitoes (Pope et. a. 1992). The study uses 1995 land use maps generated from LANDSAT TM data and reclassified land-use maps from 1985 and 1989 to compare changes in land-use with changes in malaria transmission.
Site Description
Chanthaburi province is a malaria endemic area of Thailand, located along the Thai-Cambodian border (Fig. 2). It is about one-third covered by forest with rice paddy fields representing about 30% and Para Rubber/orchard representing about 20% of the land use covered. The geographic environment comprises of mountains, hills, undulating land plain and coast land. The climate is tropical monsoon with the rainy season from April to October/November, with an average of 2,915.10 mm/year. Average temperature ranges between 26.02 and 29.56 degree Celsius.
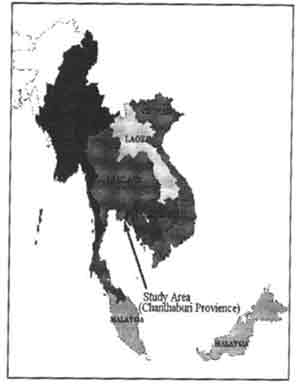
Fig. 2 Location of Study area.
Data Base and Data Analysis
Normalized difference vegetation index (NDVI) were calculated for NOAA satellite coverage's of Thailand for 10 dates between December 1992 and April 1993 by using a ratio of the visible band 1 and the near infrared band 2. These data were then composite by selecting the highest NDVI for each grid cell location. These data have been used as thematic raster base maps for displaying malaria incidence by provinces and by district. This data also has been used to determine forest cover in provinces of Thailand using unsupervised classified of raster images to create vector maps of forest cover (TNT mips, 1996). Correlation between area of forest cover and malaria incidence by province have been made (Fig. 3).
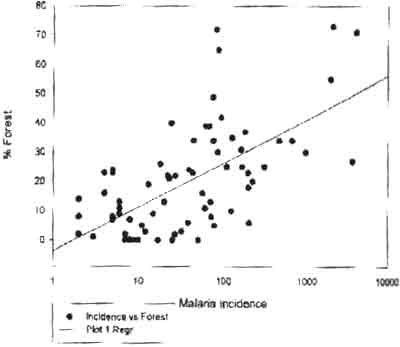
Fig. 3: Correlation between percent forest cover and malaria.
The processed calculated malaria incidence data had been incorporated in to the GIS database for each district of Chanthaburi. This data includes species of Plasmodium and origin data for malaria cases. The malariometric survey has been started in Chanthaburi Province by monitoring cases at district malaria clinics.
The land use map of Chanthaburi provinces prepared at 1:500,000 by the Land Development Department, Ministry of Agriculture and Cooperatives Thialand 1986 and 1990 were digitized. These maps for 1986 and 1990 were originally prepared from interpretation of Landsat 5 MSS and TM, respectively. These maps has been digitized using ARC/Info software. The total area for each land-use type in each district has been calculated.
Thematic maps of malaria incidence using the land use maps of Chanthaburi in 1986 and 1991 as the base maps have been created. The 1985 malaria data is displayed on the 1986 vegetation image data in which it has been found that the available existing 1985 maps were not consistent and appeared to be unreliable.
LANDSAT TM image of February 1995 has been classified to produce the land use map of the province. Land use maps included five classes. ERDAS software was used as the image processing tool .Unsupervised classification of the image was performed by defining 20 classes with 2,3 and 4 bands of TM. Intensive field verification was performed by the use of the Global position system (GPS) instruments and a GPS camera for the unsupervised image and for the training sample.
Result and Discussion
There has been substantial difficulty in comparing the existing 1986 and 1990-1991 land use maps because there were large differences in the number and type of land use categories depicted in each map. To alleviate this problem and attempt to simplify the classification scheme to correlate with malaria incidence we synthesized a new land use scheme based upon potential Anopheles virus habitats. New land use categories in Chanthaburi were generated.
In 1985 malaria incidence were higher in the provinces with the greatest amount of natural forest. Tha Mai district had an incidence per 100,000population of 37722 with 85334 hectares of forest, Pong Nam Ron had an incidence per 100,000 population of 9466 with 69145 hectares of forest and Makham had an incidence of 8217 with 48549 hectares of forest. In 1991 malaria incidence declined in all districts. In tha Mai forest acreage declined about 22% with a dramatic decline in malaria transmission. In Pong Nam Ron and Makham malaria declined but there was little or no change in forest acreage.
The relation between changes in land-use with changes in malaria transmission in Chanthaburi Province has beeen calculated and graphed between the years 1985-1986 and 1991. In Pong Nam Ron and Makham there was no correlation between forest area and malaria incidence and a slight negative correlation between rubber/orchards and transmission. There was also a positive correlation between field crops and malaria. In Tha Mai there was a positive correlation between forest area and malaria transmission (Fig.4).
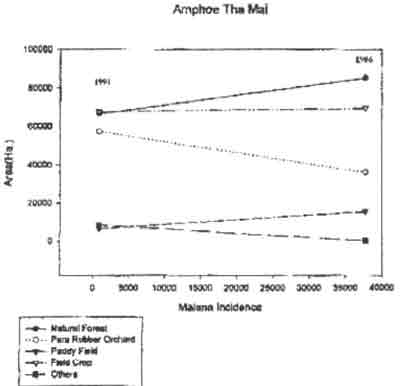
Fig.4: Correlation between changes inland use and malaria incidence in chNGE IN Amphoe Tha Mai District,
These preliminary attempts to relate malaria incidence and changes in land use between 1985-1986 and 1991 in Chanthaburi have not yielded consistent positive or negative correlation. Malaria has declined in most districts during this period even in the absence of vegetation changes. It may be necessary to correct malaria incidence data taking in account that over all decline in malaria transmission. The malaria control efforts also contributes to decline in malaria incidence.
The preliminary observation of the data of 1995 and incidence of malaria in the province district shows haphazard trend which need to be further analyses with considering the province past Environmental and malaria control action information.
Acknowledgement
This work is supported by World Health Organization(WHO).
References
- Linthicum KJ, BailyCL, Tucker CJ, et. al.; Observation with NOAA and SPOT satellites on the Effect on man-made Alteration in the Ecology of the Senegal River Basin in Mauritania on Rift Valley Fever Virus Transmission. Sistema Terra 1994; 3:44-47
- Hayes R O, et. al., Detection Identification and Classification of mosquito larval habitats Using Remote Sensing Scanners in earth orbiting Satellites, Bull WHO 1985; 63:361-374
- Pope, K.O., E.J. Sheffner, K.J. Linthicum, et. al., Identification of central Kenyan rift Valley Fever Virus vector habitats with Landsat TM and evaluation of their flooding status with airborne imaging Remote Sensing Environment. 1992; 40:185-187.
- TNT mips. Version 5.5 of the Map and Image Processing System 1996. Micro Image INC Lincoln, Nebraska.
- Rosenberg R, Andre RG, Somchit L; Highly effective Dry Season Transmission of Malaria in Thailand.Trans R Soc Trop Med Hyg 1990; 84: 22-28.