| GISdevelopment.net ---> AARS ---> ACRS 1997 ---> Poster Session 2 |
Semi-automatic land cover
classification using ADEOS/AVNIR multispectral data
Nguyen Dinh
Duong
Institute of Geography,
National Center for Natural Sicence and Technology of Vietnam
Nghiado, Tuliem, Hanoi, Vietnam
Fax: 84-4-8361192, 84-48352483
E-mail:duong@igg.ac.vn
Abstract Institute of Geography,
National Center for Natural Sicence and Technology of Vietnam
Nghiado, Tuliem, Hanoi, Vietnam
Fax: 84-4-8361192, 84-48352483
E-mail:duong@igg.ac.vn
AVNIR is multispectral high resolution sensor on board of Japanese satellite ADEOS that was successfully launched to orbit in August 1996. In the paper the author presents application of GASC (Graphical Analysis of Spectral reflectance Curve algorithm for 4 bands data set of AVNIR in land cover classification. Validation result of proposed algorithm is submitted in the paper for discussion and further improvement of the algorithm).
Introduction
Land cover is one of the most frequently extracted information from Remote Sensing data. It represents a complex mixture of natural and anthropogenic ground classes (Kalensky 1996). Land cover map is used in capturing of current physical situation of land surface for natural resources management and environmental monitoring. Up to now satellite land cover map is made usually by supervised or unsupervised classification method. The first approach requires interactive by any way. The second approach is carried out mainly by clustering technique. This is done automatically based on a number of chosen classes and separability measure among them. To get meaning full final result it requires generally very much manual reclassification with ground truth data collection using different information sources such as thematic maps, field survey and photos etc. The AVNIR sensor on board the Advanced Earth Observation Satellite produces high resolution data in four spectral bands offers new information source for land cover mapping in large scale. In order to speed up classification the author proposed to use GASC algorithm (Graphical Analysis of Spectral reflectance Curve) that is being developed under framework of NASDA ADEOS-II RA for automatic classification of future GLI data. Instead of 6 bands of GLI sensor, the GASC algorithm will be applied for only 4 bands of AVNIR to produce interim product that will be refined by manual classification to meet requirement of land cover mapping in large scale. By application of this algorithm the author expects a shortening of multispectral classification and achievement of more objective and standard interim result that should derive more reliable final land cover map. In order to demonstrate this algorithm the author used ADOES/AVNIR Osaka scene observed on Oct., 17, 1996 level 1B2-GD distributed on CD EORC-011 by NASDA.
GASC algorithm for four spectral data set
The four spectral bands of AVNIR sensor are equipment to blue, green, red and infrared waves. Given a pixel vector
P(b1,b2,b3,b4)
b1 Normalized digital count of band Mu 1
b2 Normalized digital count of band Mu 2
b3 Normalized digital count of band Mu 3
b4 Normalized digital count of band Mu 4
then its spectral reflectance curve can be drafted as follows
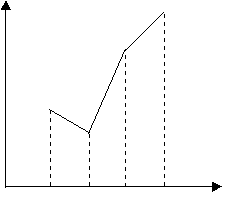
Fig. 1: Definition of spectral reflectance curve.
For ADEOS/AVNIR data band 1, band 2, band 3 and band 4 refer to blue, green, red and infrared band. In order to describe shape of spectral reflectance curve defined by four spectral bands we need to develop several invariant.
Delta invariant: This invariant is defined by six parameters that simulate modulation of spectral curve. These six parameters are as follows:
M1 Relation between band 2 and band 1.
M2 Relation between band 3 and band 1.
M3 Relation between band 3 and band 2.
M4 Relation between band 4 and band 1.
M5 Relation between band 4 and band 2.
M6 Relation between band 4 and band3.
The value M1 is assigned 1 when b2<b1, 2 when b2=b1 and 3 when b2>b1. The value of Mi for the other band pairs is defined by similar way. From theoretical point of view, there would be 3 power 6 possible combinations of Mi. If we assign each combination one integral value then this value will range from 0 to 728. In practice the number of combination is far less then this value and is about 74 only.
Alpha invariant: This is angle a defined as on the Fig. 2
Beta invariant: This is angle b defined as on the Fig. 2
Gamma invariant: This invariant is defined as an area of the polygon ABCDEF on Fig.2
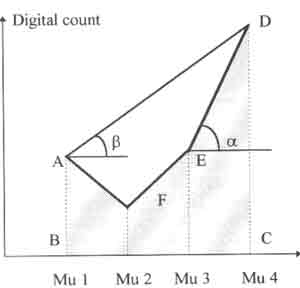
Figure 2 Definition of Invariant alpha, beta and gamma.
Classification
The above invariant was used for automatic classification. Since there is still no ADEOS/AVNIR data for Vietnam, research was conducted by the use of a window of Osaka scene observed on Oct. , 17, 1996 level 1B2-GD distributed on CD EORC-011 by NASDA The size of the window is 1024 pixels x 1024 lines. On figure 3 is false color composite of the study area. The study area is situated near to a lake. There is many land cover categories that can be used for algorithm validation: Forest, grass land or shrub, built up area, built up area mixed with vegetation, dry bare soil, wet bare soil, water surface…
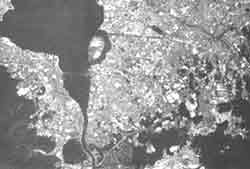
Fig. 3 False colour composite of study area.
As the first step of processing is to cut out a window from original Osaka image. The size of the window is 1024*1024. This image data is further encoded by Encoding function of WinASEAN 3.0 Image Work. The purpose of encoding is to transform image data to spectral format to avoid repeated computation. After encoding we can know how many unique pixel vectors are available for the image data and processing will be carried out not on pixel by pixel but vector by vector basis. Due to lack of knowledge on land cover situation of the Osaka area so very modest legend was established. In order to find out meaning of each spectral pattern we assigned different spectral pattern different code and colour display it as classified image. On Fig. 4 is classified image by simple algorithm. On this image blue colour is assigned to code 0, light green to code 9, dark green to code 26, red to code 80 and yellow to code 53 and 54. When compare this classified image with the original one on Fig. 3 we can make the following conclusion:
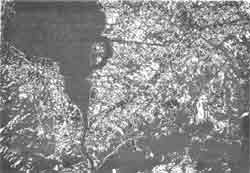
Fig.4 Classification by simple algorithm.
- Code 0 stands for water, construction (pure built up area) and clouds of different thickness
- Code 1,2 stands for built up area mixed with water surface
- Code 5 stands for bare area
- Code 8 stands for vegetation mixed with built up area. This code can be further divided to smaller classes
- Code 17 stands for bare area and vegetation
- Code 26 stands for pure vegetation with different density of coverage
- Code 27, 31, 35 44 can be interpreted as bare land
- Code 53 and 54 stand mostly for agricultural bare land (paddy field)
- Code 728 stand for bare land or built up area
- In case of code 0
if gamma < 300 ->water
if 300<gamma<600 ->bare
if gamma>600 ->cloud
- In case of code 8
if gamma<230 ->vegetation type 1
if gamma>230 ->built up area mixed with vegetation
- In case of code 26
if gamma>260 ->vegetation type 2
if 260<gamma<300 ->vegetation type 3
if alpha<105 -> built up area mixed with vegetation
if gamma>300 ->vegetation type 4
- In case of code 80
if gamma<400 ->bare soil type 1
if gamma>400 ->bare soil type 2
- In case of other values of code ->bare surface
| Blue colour | -Water body |
| Red colour | -Bare land |
| White colour | -Cloud or pure bare surface |
| Light green | -Vegetation mixed with built up area |
| Dark green | -Vegetation with dense coverage |
| Cyan | -Grass land or shrub |
| Yellow | -Bare soil-dry paddy field |
| Brown | -Bare soil- wet paddy field |
| Magenta | -Built up area |
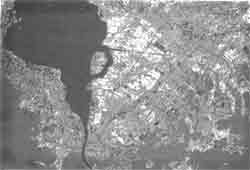
Fig.5 Classification by improved algorithm.
Conclusion
This is a preliminary result of research of application of GASC algorithm for four spectral data set of AVNIR sensor. The result pointed out possibility to use modulation of spectral reflectance curve as one of data feature for multispectral classification. By combination of this modulation with properly selected thresholds of graphical invariant it is possibly to automatically classify image to produce interim result which requires only small manual reclassification before becoming a final product that meets practical requirement of land cover mapping in large scale. The proposed method is sensor dependent and scene independent if the input image is well calibrated and pixel radiance is adequately normalized.
Acknowledgement
The author thanks joint NASDA-ESCAP ADEOS project for the sponsorship to undertake this research. The author express also acknowledgement to Fundamental Research Program of Vietnam for supporting this research.
Reference
- Kalensky, Z.D., 1996. Regional and Global Land Cover Mapping environmental Monitoring by Remote Sensing. Proceedings, XVIII Congress, Commission IV, Working group 6. Nguyen Dinh Duong, interim progress report of research study "Semi-automatic land cover classification using ADEOS-AVNIR multispectral data", ESCAP 8/1997.
- ADEOS Reference Handbook, NASDA 1997.