| GISdevelopment.net ---> AARS ---> ACRS 1997 ---> Poster Session 2 |
Satellite Monitoring of
Coastal Topography in La Union, Northwestern Luzon, Philippines
Salvador,
J.H.G.1, Kanbara,H.2, Sato, T.2,
Machida,S3, Almeda, R.1,Garelan, S.4, and
Laserna, S.1
1Mines and Geosciences Boreau,
North Ave., Diliman, QC, 1101 Philippines.
Fax (632)928-8544
2Nikko Exploration and Development,
Condition., Ltd., 7-10 Toranomon 2-Chrome,
Minatoku,Tokyo, Japan.
Fax(81)3-3508-9785
3Earth Remote Sensing Data Analysis Center,
Roppongi First Bldg., Tokyo, Japan
4Mines and Geosciences Bureau,
Regional Office No. 1,
San Fernando, La Union, Philippiness
Abstract 1Mines and Geosciences Boreau,
North Ave., Diliman, QC, 1101 Philippines.
Fax (632)928-8544
2Nikko Exploration and Development,
Condition., Ltd., 7-10 Toranomon 2-Chrome,
Minatoku,Tokyo, Japan.
Fax(81)3-3508-9785
3Earth Remote Sensing Data Analysis Center,
Roppongi First Bldg., Tokyo, Japan
4Mines and Geosciences Bureau,
Regional Office No. 1,
San Fernando, La Union, Philippiness
Eight different datasets that include the 1946 aerial photographs, the Landsat MSS, Landsat TM and JERS-1 OPS from 1972 and 1994 covering La union, Philippines were studied. The images documented the change in the beach line configuration of the Santo Tomas Spit due to rapid coastal erosion. In particular, there is regression of about 200 meters along the coastline and growth of the spit landform by more than one kilometer southward.
Introduction
This study is a part of the three-year Philippines-Japan cooperative undertaking by the Philippines Mines and Geosciences Bureau (MGB) under the Dept. of Environment and Natural Resources (DENR), the Nikko Exploration and Devt. Condition., Ltd. (NED) and the Earth Remote Sensing Data Analysis Center (ERSDAC) of Japan. The main objective is to apply remote sensing technology to the management of the coastal environment and resources in Luzon.
The Sto. Tomas Spit is located along the coast of La Union in northwestern Luzon. It is bounded by latitudes 16014'30" N to 16020'00"N and longitudes 120020'00"E to 120025'00"E. It is about two km at its widest portion and eight km long tapering gradually to the south. The Santo Tomas Spit is probably formed by the action of south-flowing longshore currents. The Aringay-Pugo River on the northeast is probably the source of quaternary materials that make up the spit (Duna, 1963).
The study area has a type I climate. The dry season starts in November and ends in April. The rainy season is from May to October. The total annual rainfall in La Union is 2,409 mm. Typhoons and monsoons usually accompany the rainy season.
Methodology
False color composites were prepared from available Landsat TM, MSS and JERS-1 POS images (Table 1). The images were geometrically corrected to a 1:50,000 scale topographic map. These images and the 1946 aeraial photograph were superimposed (Figs. 1,2 and 3). The changes in the configuration of the coastline over time were interpreted from the superimposed images. A fieldwork was conducted to verify some results.
| Data | Path/Row | Acquisition Date |
| Aerial Photograph | 125/49 | 21 November 1946 |
| Landsat MSS | 125/49 | 18 November 1972 |
| Landsat MSS | 125/49 | 10 May 1976 |
| Landsat MSS | 125/49 | 21 February 1979 |
| Landsat TM | 117/49 | 27 April 1988 |
| Landsat TM | 117/49 | 24 May 1992 |
| Landsat TM | 117/49 | 11 March 1994 |
| JERS-1 OPS | 91/273 | 06 November 1993 |
III Results and Discussions
Figure 1 shows the 1972, 1976 and 1979 configuration of the Sto. Tomas Spit derived from Landsat MSS images. The fourth drawings show the superimposed three datasets. The latter shows that considerable coastal erosion occurred between 1972 and 1976 along the length of the spit. This process was followed in 1976 to 1979 by a dominantly sedimentation process causing the spit's southern end to grow.
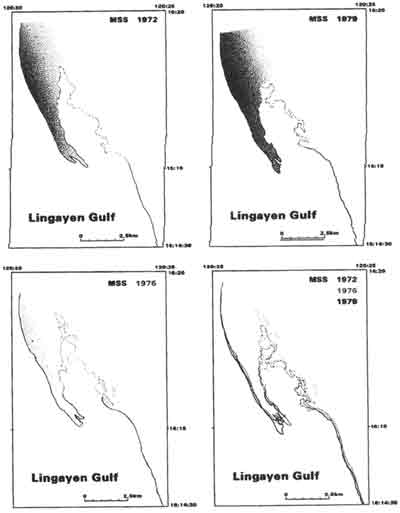
Figure 1 The changes in the coastline configuration of the Sto. Tomas Spit in La Union derived from the 1972, 1976 and 1979 Landsat MSS Images.
Figure 2 shows the 1988, 1992, 1994 and the superimposed configuration of the same coastline derived from several TM images. From 1988 to 1992, there was little noticeable change in the coastline. However, from 1992 to 1994, there is considerable erosion observed on the western side and a noticeable growth on the spit's southern part. This is related to the increased sedimentation induced by the 1990 Luzon earthquake which loosed up the sediments. These features were verified by ground survey.
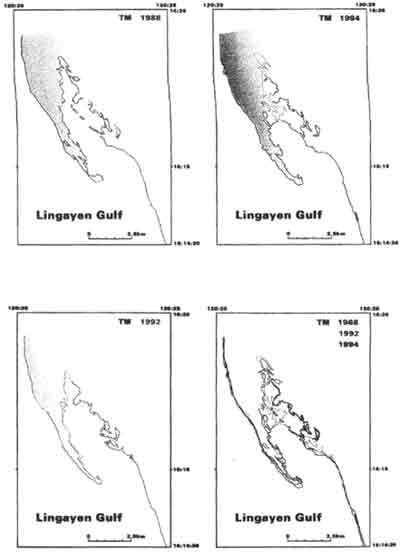
Figure 2-The changes in the coastline configuration of the Sto. Tomas Spit in La Union derived from the 1988, 1992 and 1994 Landsat MSS Images.
Figures 3 shows the coastline's configuration derived from the 1946 aerial photograph, the 1976 MSS, the 1994 TM and the superimposed images. The latter shows an erosion of about 200m on the west side of the spit. This affected a local baranggay. It also shows an approximately 1,176 m growth of the spit's in 48 years. This growth is believed to be related to increased sedimentation caused by typhoons and the July 1990 earthquake (Fig.4). Furthermore, the eroded sediments on the west coast may have been transported and deposited on the southern end thus contributing to its growth. We believe that at present, the Sto. Tomas Spit continues to grow.
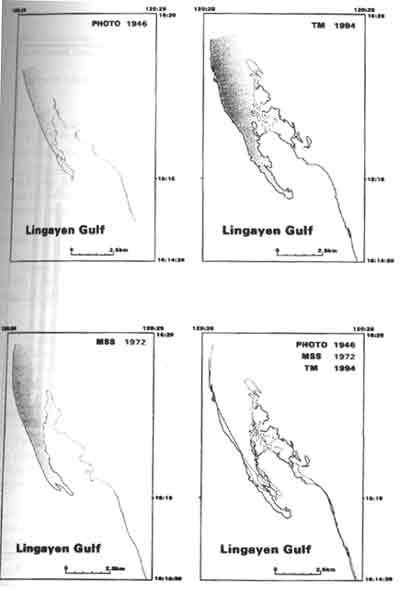
Figure 3-The changes in the coastline configuration of the Sto. Tomas Spit in La Union derived from the 1946 aerial photograph, 1972 Landsat MSS and 1994 Landsat TM Images. Note the erosional feature on the western side and the growth of the southern end of the spit landform.
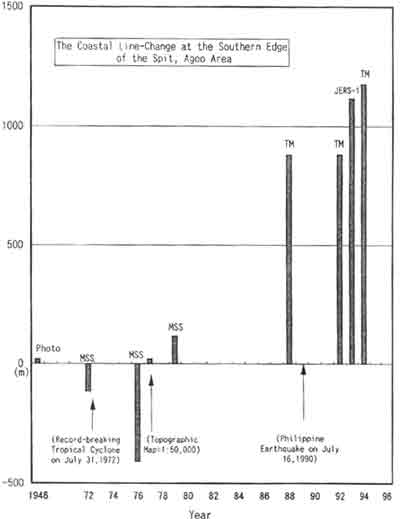
Figure 4-The plot of the distance vs.time coastline change at the southern edge of the Sto. Tomas Spit.
Conclusion
The foregoing results and discussion documented the change in the beach line of the Santo Tomas Spit in La Union due to rapid coastal erosion and associated sedimentation.. In particular, the Santo Tomas spit was eroded by about 200 meters along the western coastline and grew by more than one kilometer southward. We believe that the spit continues to grow southward. These growth processes are believed to be related to the increased sedimentation caused by intense typhoon and the 1990 Luzon earthquake.
Reference
- Duna, Benjamin G., 1963. Preliminary Report on the Geology and Mineral Resources of La Union Province. BMG internal Report.