| GISdevelopment.net ---> AARS ---> ACRS 1997 ---> Poster Session 2 |
Cloud Masking Techniques for
AVHRR Data for Oceanographic Applications in Malaysia
Khiruddin Abdullah *,
Nasirun Mohd. Saleh *, Alui Bahari+, Ruslan Raints * and Yusuff
Mahamod*
*University Sains Malaysia,
+Malaysian Metrological Service
Abstract *University Sains Malaysia,
+Malaysian Metrological Service
The objective of the present work is to apply AVHRR cloud masking producers to full resolution AVHRR images over sea water areas around Malaysia. The techniques used are (1) gross test-uses channel 5 brightness temperature, (ii) spatial coherence technique - consist of defining 3x3 pixels ( local array ) and calculating local mean and standard deviation using channel 4 data over each local array of brightness temperature, (iii) dynamic reflectance threshold test-channel 2 reflectance is use sine it is less affected by aerosol and molecular scattering, (iv) ration of near infrared ( channel 2) to visible ( channel ) reflectance's -cloud and cloud free pixels are identified form the histogram of this ratio and (v) channel difference-by examining the difference in brightness temperatures between thermal channels. All the above methods are used for day time test. The technique have been applied to AVHRR scenes have indicated that the threshold values obtained are consistent for each technique. A program incorporating the above techniques using the determined threshold values has been written for performing cloud masking for full resolution AVHRR images. A pixel will only be considered cloud free if it passes all the tests.
Introduction
AVHRR data from NOAA satellites have been widely use in oceanographic applications such as sea surface temperature ( SST) studies and other oceanic phenomena. Due to its high repetitive coverage AVHRR can become a use full tool for monitoring the oceanic processes. The atmosphere introduces errors in satellite measurements of SST through cloud cover, aerosols, water vapour, reflected sky and the presence of other gases. Clouds dominate the errors introduced into satellite observations of SST. Therefore the presence of clouds hinders their application especially in the equatorial region. Successful application of remote sensing data for oceanographic studies such as sea surface tem0perature measurements depends largely on the accuracy of the cloud removal techniques to eliminate cloud-contaminated pixels for m the analysis.
Methods of cloud removal for satellite data vary form radioactive thresholds to rather complicated procedures involving analysis of texture ( Saunders 1986, Gelloegos et al. 1993, Simposen and Humphrey 1990, Simpson and Gobat 1996). The techniques use by Saunders and Kriebel (1988) which are based on the rediative thresholds had been successfully applied in Western Europe and the North Atlantic have been adopted in the present study. But their application in the South East Asia equatorial region such as Malaysia still require some modification in terms of their threshold values which have been obtained by investigators using data sets form other geographical regions. A study by Franca ( 1994) has indicated that the thresholds values obtained for the equatorial region of Brazil differ form that obtained by Saunders and Kriebl ( 1988). Knowledge of cloud type within the image is not needed for this procedure.
Data
AVHRR scene acquired between March 1996 to March 1997 were used in this study. Sub scenes consisting of 850 pixels and 800 lines covering the sea water areas around Malaysia ( the South China sea and the Straits if Malacca ) were extracted for detailed analyses. These data sets were captured by NOAA-12 and NOAA-13 satellites series.
Cloud Detection Technique
Different clouds have different optical and thermal properties. Each cloud filtering technique has to unique capability. No single technique can eliminate all cloud types form the satellite data. A combination of these techniques is essential for very high certainty in cloud masking. Day time and night time cloud detection schemes are briefly described below.
- Infrared Threshold Test or Gross Cloud Check
This method uses 12 mm ( channel 5) brightness temperatuerr4. channel 5 is used because clouds have greater optical thickness at this band . pixel will be flagged as cloudy if the calculated temperature is less than a pre-defined threshold value. The thresholds have to be determined form the histogram of the brightness temperature generated image. this test is applicable for both day and night scenes. This method is not capable of detecting a warm low cloud above the sea.
- Spatial Coherence Technique
This method was developed by Coakley and Bretherton ( 1982) which uses the spatial structure of the infrared radiance field for obtaining cloud cover and determining clear sky radiances. It relies on the fact that cloud top radiances often vary over small spatial scales whereas the radiance form the sea surface is uniform over large areas. If cloud-free pixels do to exhibit uniformity, such as in coastal areas where there are usually large variations in surface temperatures, this test will have difficulty to identify them. A modified version of this technique was introduced by Thiermann and Ruprecth ( 1992).
- Dynamic visible and Near Infrared Threshold Technique
The reflectance of most cloud types is higher than that of the sea at visible and near-infrared wavelengths away form areas of secular reflection . radiation of shorter wavelengths ( channel 1) is more affected than radiation at longer wavelengths by aerosols and Rayleigh scattering. Land and cloud have higher albedeo at longer wavelengths. Therefore channel 2 radiances are preferred for cloud detection over the sea because the higher radiances reflected form the land can also be masked out. The land surface has much lower reflectance than clouds in channel 1, thus giving high contrast between land and cloud at this wavelength. This favous the use of channel 1 for cloud detection over land.
The threshold for cloud is a function of solar zenith angle, satellite zenith angle and azimuthal angle of the view point. It can be determined dynamically from the reflectivity histogram. The visible histogram can two cloud-free peaks over coastal regions ( sunders 1986) to which the dynamic threshold cannot be applied successfully. To overcome this problem a constant threshold can be used.
- Ratio of Near -Infrared Reflectance to visible Reflectance
This test is only applicable during the day. The bi-directional reflectance is defined as
Rn= (GnCn+Yn) /cos (1)
Where Gn is the gain, Yn is the intercept, Cn is the raw count for channel n and is the solar zenith angle ( Saunders and Kriebel 1988). The ratio used in the test is defined as
Q=R2/R1 (2)
Over clouds the value of Q is close to unity. Enhanced molecular and aerosol backscattering at shorter wavelength over cloud -free water causes the visible reflectance to be often twice that in the near-infrared. The value of Q is then about 0.5. however over land the reflectance at the near-infrared wavelength is always higher than the visible reflectance and thus Q is always greater than unity. Cloud-free pixels can be determined by using pre-defined or dynamically defined thresholds. The test cannot be applied on sunglint areas because the value of Q can approach unity and this will falsely flag clear pixels as cloudy.
- Channel Difference
The emissivity difference of low cloud and fog at 3.7 mm and 11 mm provides an effective test at night for the detection. The emissivity of stratus or fog is greater at 11mm than at 3.7mm. this technique is use full since uniform low cloud at night is the most difficult to detect with either the infrared or the spatial coherence method.
The test using T3.7-T12 is useful for detecting pixels partially filled with cloud, semitransparent cloud an most medium-level and high-level clouds . thin cirrus cloud is easily detected by this method because this cloud provides higher differences in transmissivity an single scattering albedeo between 3.7mm and 12mm.
The temperature differences between T11 and T12 can be applied to both day time and night-time. This test is effective in detecting thin cirrus cloud and the edges of thicker cloud. This technique can be used to detect most types of clouds except for uniform low cloud. For clear sky radiances, the difference are less ( often <1 degK) but will vary with total column water amount and satellite zenith angle ( saunders and Kriebel 1988). Over cloud the brightness temperature differences are higher than over the clear sea water. All pixels with T11-T12>Tdiff ( threshold for temperature difference ) are then identified as cloud contaminated.
Daytime cloud detection procedures described in the previous section were applied to each AVHRR scene. The brief outline of the algorithm applied to AVHRR data during the day to detect cloud contaminated pixels is displayed in Figure 1.
Figure 1: Outline of the algorithm applied to AVHRR data during the day to detect cloudy pixels.
For each image data, several small sub-scenes ( channels 1,2,4,5) that contained clouds and cloud free water pixels were extracted for detailed study using each technique mentioned above. In order to simplify the data processing, digital numbers ( DN) were use din our analyses instead of using albedeo and brightness temperature values. The boundaries between cloudy and cloud free pixels were manually assigned and the pixels values for each class were noted. This inspection requires trained analyst. The threshold value was then determined for each technique based on this classification.
The first test applied was the thermal threshold using channel 5.A brightness temperature image ( in digital number ) of each sub-scene was created and a histogram of the image was also generated. From the analyses of all the images the DN value of 200 was assigned as the threshold for cloud-contaminated pixels. A cloud mask file was also generated where all pixels with DN higher (Tb5 lower ) than the threshold were assigned 0 ( black) and those below threshold to 255 ( bright ). It is also noticed that low, warm cloud was not detected by this method.
In the spatial coherence technique, a moving array of 3 pixels by 3 pixels was used. The central pixels with standard deviation grater than a defined threshed were classified as clouds. The spatial coherence image was then generated. The threshold was defined at 1.9 and this masked out high cloud and land. However this method cannot detect uniform cloud top layer.
The third test applied was the near infrared threshold technique ( channel 2). Thoroughly study of the reflectance maps of the sub-scenes indicates that the threshold values for the NOAA-13 data sets ( afternoon passes ) were higher than that of NOAA-12 ( morning Passes) . the effects are caused by the lower solar elevations during NOAA-12 overpasses. The cloud masks were produced by a threshold value of DN 6 and 11 for NOAA-12 and NOAA -13 respectively.
The next test was the ration of the near infrared bi-directional reflectance to the visible bi-directional reflectance. The generated Q image and the histogram of calculated Q values were used to identify cloud-free pixels. The values than above cloud. Therefore selecting a thresho9ld for cloud will mask the land out as well. This is useful for sea application.
The final test applied for the daytime cloud detection scheme was the channel difference. High cold cloud can be detected easily because their T11-T12 values are larger. On the other hand, low cloud could not be separated easily form the cloud-free sea pixels. If the temperature difference was greater than the threshold value then the pixel was flagged as cloud contaminated. Land areas have T11-T12 values grater than sea water. The temperature difference for high cloud is higher than for land. Therefore, for SST application, choosing a threshold for land will eliminate cloud as well.
Small variations for the threshold values for each technique were noted using different images dates. The mean values obtained from these preliminary results are tabulated in Table 1. after the data were passed through the series of tests described earlier, the combined cloud masks were finally obtained ( figure 2).the land areas were also masked out using bad 2 data. The cloud mask can then be applied to the corresponding image for elimination of cloudy pixels.
| Detection technique | Threshold | ||
| Gross cloud check | 200 | ||
| Spatial coherence | 1.9 | ||
| Channel 2 reflectance | 6( NOAA12), 11 ( NOAA13) | ||
| Ratio, Q=R2/R1 | 0.7 | ||
| Channel difference | -3.1 |
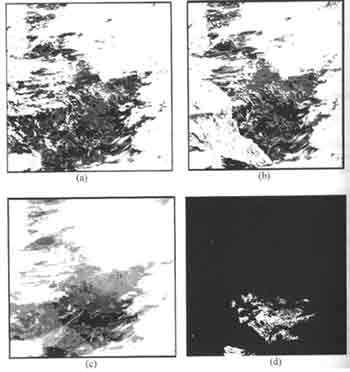
Figure 2.(a) channel 1 AVHRE images captured on 24 June 1996, (b) channel 2 image , (c) channel 5 image from the same scene and (d) the combined cloud mask generated using the cloud masking algorithm ( dark and bright areas are cloud covered and cloud free water pixels respectively).
Conclusion
This cloud detection scheme has been applied to many AVHRR passes at different times of the years and by inspection of the cloud mask no significant amounts of contaminated pixels have escaped detection.
For validation of the results, the SST of cloud free pixels were estimated. The computed values are in the ranges of 280 to 330C for data sets from NOAA-12 using the multi channel sea surface temperature algorithm . the in-situ data coincident with the images were not available for reference. However the temperatures derived from this established algorithm are within the range of SST values for this region and this indicates the ability of this scheme to cope with the atmospheric conditions. Therefore this program can be used for eliminating cloud contaminated pixels from real-time satellite images for oceanographic applications in sea water areas around Malaysia.
However there is still ambiguity in determining the thresholds and it is a difficult task due to complex meteorological situations in South East Asian region. Further investigation has to be carried out to verify this problem.
Acknowledgments
The authors would like to thank the Universiti Sains Malaysia for funding this project through the short term research grant, the Malaysian Meteorological service for providing AVHRR images, the students, Mohd Zaini, Mohammad Rahimy Fitri, Murali Shangkar and Jesu Iruthaya Nathan for their help in the data analysis and also the helps form the staff of the Geophysics Laboratory, USM.
Reference:
- COAKLEY, J.A, and BRETHERTON,F.P. ., 1982., Cloud cover from high resolution scanner data: detecting and allowing for partial fields of view. J.Geophys . Res ., 87, C7, 4917-4932.
- FRANCA, G.B., 1994, Atmospheric correction for retrieving of quantitative information from visible and thermal infrared remotely-sensed data. PhD thesis, University of Dundee.
- GALLEGOS, S.C., and HAWKINS , J.D., and CHENG, C.F., 1993., a new automated method of cloud masking of advanced very High resolution Radiometer full resolution data over the oceans. J. Geophys. Res., 98, 8505-8516.
- SAUNDERS, R.W., 1986, An automated scheme for the removal of cloud contamination form AVHRR radiances over western Europe. Int J. Remote Sensing, 7, 867-886.
- SAUNDERS, R.W., and KRIEBEL., K.T., 1998, An improved method for detecting clear sky and cloudy radiances from AVHRR data., Int. J.Remote sensing, 9, 123-150.
- SIMPSON .J.J., and HUMPHREY., 1990, an automatic cloud screening algorithm for day time advanced very high resolution Radiometer Imagery., J.Geophys. Res., 95, 13459-13481.
- SIMPSON, J.J., and GOBAT, J.I., 1996, Improved cloud detection for daytime AVHRR sense over land. Remote sensing. Environ., 55, 21-49.
- THIERMANN, V., and RUPRECHT, 1992 A method for the detection of clouds using AVHRR infrared observations. J. Remote Sensing, 13, 1829-1841.