| GISdevelopment.net ---> AARS ---> ACRS 1997 ---> Poster Session 2 |
Change Detection Analysis of
Urban Forest in Klang Valley using Multiemporal Remote sensing Data: some
Preliminary Result
Norhan Mat Yusoff and
Mazian Hahin
Faculty of engineering and GeoInfromation science
Universiti Teknologi Malaysia
Locked Bag 791, 80990 Johar Bahru
Tel: 07-5502969, Fax: 07-5566163,
E-mail:mazlan@fksg.utm.my
Abstract Faculty of engineering and GeoInfromation science
Universiti Teknologi Malaysia
Locked Bag 791, 80990 Johar Bahru
Tel: 07-5502969, Fax: 07-5566163,
E-mail:mazlan@fksg.utm.my
This paper reports some preliminary results of change analysis over kang Valley urban forests. In this study , a set of multitemporal Landsat Thematic Mapper data were transformed using Principal Component Analysis ( PCA) which the least correlated components produced were used in analyzing changes with in the forested area. Early results of this study indicated theta changes detected and analyzed periodically using remote sensing technique is useful in monitoring urban forest. Efforts rate now being made to translate the degree of changes detected to that of its nature on the ground.
Introduction
Development can be analysed by comparing the extent of growth periodically. Changes in land use activities and types influenced by the various types of land development. Economic and physical planning is inseparable as they are both major components in developing a nation. Klang Valley covers an area of 3,200 sq. Km. The rapid growth in population, industrial activities and developments are some of the major changes reflecting the continues 9% economic growth in the last 3 years. Some of the development are well monitored and detected by the authority. Undeniably, there are exploitations of urban forest for other uses in which these activities can be detected by collecting data periodically and analyzing any drastic changes. This paper reports changes that took place in the urban forest of Klang Valley, detected and analysed using remote sensing technique. Multitemporal remote sensing data namely Landsat Thematic acquired in 1991 and 1993 were used in this study, respectively. This paper reports the early study of change detection by using Principal Components Analysis ( PCA) to a single multitemporal dataset to produce higher components which are least correlated and related to change.
Material & Method
Study area
The region of study is the Klang Vallay and its surrounding area ( Fig. 1). The land cover class of interest is the urban. Land Thematic Mapper data of the year 1991 and 1993 were selected because of the improved radiometric , spectral spatial and temporal resolution by TM economic, land use and resource development. To understand and to map important landforms and their changes, we must have the capabilities to detect and map surface variability temporally, spatially and spectrally ( Chavez et. Al., 1996). Digital images were useful for monitoring and change detection because they allow area to be studied form a regional perspective, and the repeat coverage offered by satellites.
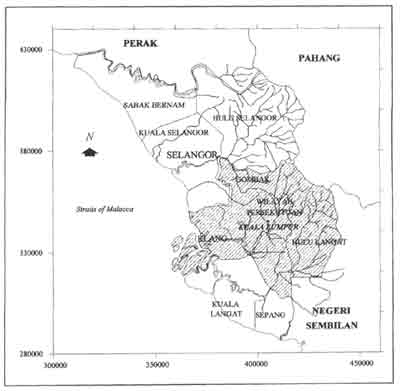
Figure 1: Study Area - Klang Vally is shown in the shaded area
Data Processing
- Geometric Correction
Two multispectral Landsat Thematic Mapper senses acquired in 1991 and 1993 were both registered to a common database . to ensure high geometric accuracy is achieved, a RMSE of less than 0.5 pixel is tolerated in the geometric correction. The cubic Convolution was adopted in the resampling scheme. Digital image processing system EASI/PACE PCI was used in the data processing.
- Change Detection
change detection was carried out based on the analysis of the least-correlated components of the Principal Component Analysis ( PCA) output. In this technique, all raw bands ( totaling 14 bands ) were used as main input the PCA. A set of 14 correlated information's were transformed. Up to 95% of information were transformed into the first three highly -correlated components of the PCA output while the least-correlated in information were transformed to the last few components produced. The least-correlated components, in real world can reflect to changes that have taken place in the range of period where the data were captured.
Fourteen components were generated in the PCA transformation. The eigenvalue, deviation and its variance percentage is given in Table 1.
| Eigenchannel | Eigenvalue | Deviation | %variance |
| 1 | 4712.3721 | 68.6467 | 50.44% |
| 2 | 3397.9480 | 58.2919 | 36.37% |
| 3 | 769.8112 | 27.7455 | 8.24% |
| 4 | 160.3480 | 12.6629 | 1.72% |
| 5 | 93.3378 | 9.6611 | 1.00% |
| 6 | 70.8839 | 8.4193 | 0.76% |
| 7 | 56.3467 | 7.5064 | 0.60% |
| 8 | 23.0203 | 4.7980 | 0.25% |
| 9 | 17.1336 | 4.1393 | 0.18% |
| 10 | 12.5489 | 3.5424 | 0.13% |
| 11 | 11.8361 | 3.4404 | 0.13% |
| 12 | 9.9092 | 3.1479 | 0.11% |
| 13 | 5.7050 | 2.3885 | 0.06% |
| 14 | 1.8554 | 1.3621 | 0.02% |
The first principal component ( eigenchannel 1) of the TM scene accounts for 50.44% of the variance in the entire multispectral multitiemporal data set ( Table 1.) the second component accounts for 36.77% of the remaining variance. Cumulatively,. The first four components account for 96.77% for the variance. The higher the principal components , the degree of variance ( information plus noise ) decrease . changes can be detected form the higher principal component were some features were individually distinct ( Plate 3.). the importance of PCA is that some of the characteristics enhanced in the first three components are not enhanced in the higher components. But, some of the features will be enhanced better in the higher components which are not correlated in the first three correlated components by PCA. Plate 1 a and b show the combination of images bands 4,5 and 3 displayed in RGB colour composite for the year 1991 and 1993 respectively. Plate 2a and b show the combination of Principal Components in RGS plane to depict changes.
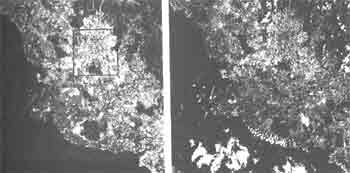
Plate 1 Colour Compositer of Landsat TM Bands 4, 5, 3 acquired in a 1991 and b 1993
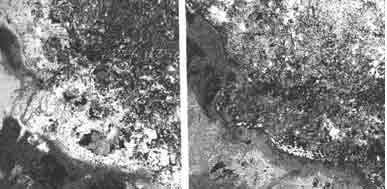
Plate 2 Colour Composites of Principal Components in RGB
a Principal Components 1, 2 & 3 in Red, Green & Blue plane - reflects no change (similarity)
b Principal Components 4, 5 & 6 in Red, Green & Blue plane - reflects changes
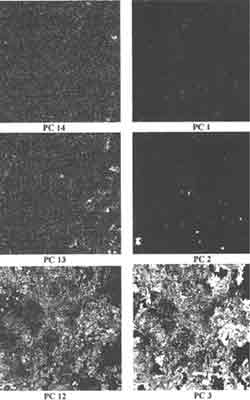
Plate 3 Principal Component a 12, 13 & 14 and b 1, 2 & 3 for the Subscene Area
Summary
This paper reports on the prerequisite study of change detection by using PCA. Statistics report regarding university and multivariate is essential in helping recognize the principal components that could show changes and is relevant to a specific study. Low cumulative value of the first two principal components (86.81%) shows that changes or low correlation occurred in the raw 14 channel data set. For a single dataset of single date, the first two components would make up for the 95% of the variance cumulation. Undeniably, inaccuracy of the final result is affected by atmospheric, radiometric and sensor tracking differences between period and inaccuracy in registration of data .
Reference:
- Chavez, P., Velasco, M., Anderson, J., Sides, S., Wethlands and
water Quality changes detection in san Francisco Bay Ecosytem Using
Remotely sensed Images.
http://sfbay.wr.usgs.gov/access/change-detect/change_detect_SFB - Jenson, J.R.(1996). Introductory Digital Image Processing : A remote sensing Perspective 2nd . ed. , USA: Prentice-Hall, Inc.
- Richards, J.A.(1986) Remote sensing Digital Image Analysis: An introduction: 1st .ed. Germany : Springer-Verlag Berlin Heidelberg.