| GISdevelopment.net ---> AARS ---> ACRS 1997 ---> Poster Session 2 |
NOVAA Weather satellite WWW
Server at UKM
Y.Y.Meng, M.Ismail,
Z.A.Abdual Rashid ad O.A.Karim
Faculty of Engineering
University Kebangsaan Malaysia
43600 UKM Bangi
selangor Darul Ehsan, Malaysia
Tel: 603-8296322 Fax; 603-8296146
E-mail:cyymeng@pl.jaring.my
Abstract Faculty of Engineering
University Kebangsaan Malaysia
43600 UKM Bangi
selangor Darul Ehsan, Malaysia
Tel: 603-8296322 Fax; 603-8296146
E-mail:cyymeng@pl.jaring.my
A ground station has been installed at Universiti Kebangsaan Malaysia (UKM) to receive the VHF signal form the united state National Oceanographic and Atmospheric Administration(NOAA) Low Earth Orbiting Satellite (LEO) werther satellite series. The satellite signal was received and decoded as image which was displayed on computer screen in the form of visible light, infra-red or the combination of both. The image file is then processed into the UKM campus network. In order to share the weather information on-line, a web-site server is now being set-up in UKM ( http://comsat.eng.ukm.my ).
Introduction
NOAA is a United State government organization which missions are to describe and predict changes in the earth's environment, and conserve and manage wisely the nation's coastal and marine resources to ensure sustainable economic opportunity[1]. There are two types of NOAA's operational weather satellite: geostationary operational environmental satellites ( GOES) for short-range warning and " now-casting " and polar-orbiting satellites ( POES) for longer-term forecasting [2].the NOAAs polar orbiting satellite transmit signals on frequencies in the range of 136MHz to 138MHz.
The world wide Web server which has been installed will be used to relay the natioal weather information to public. The main objective is to create a digital library, which contains information about the current and past satellite images from NOAA's Polar-orbiting Operational Environmental satellite. The WWW homepage is designed to provide on-line easy access to the satellite data. It allows users to search the satellite data databases, view the real-time or historical satellites images and download the weather image for further processing analysis. The satellite data, which is in the form of image, consists important information for weather analysis, forecasting, climate research and predication
UKM NOAA Ground Station
UKM ground station is located at Faculty of Engineering at 3009' North, 101049' East which is close to the equator. It can be categorized into hardware an management software.
i. Ground Station Hardware
fig. 1 shows the block diagram of the ground station [3]. The heart of the ground station is the Timestep© pro-scan weather satellite receiver. Basically , it consist of an antenna, FM receiver, and a decoder card which is installed in the computer to display the image. the receiver operating range is from 137.30MHz to 137.85MHz. the antenna was mounted such that a clear line of sight path to the North and south horizon was achieved and it was positioned away from sources of interference. It is non-directional antenna, which is, consist of two element crossed dipole and crossed reflector with a gain of 8dBi. The dipole-reflector spacing has been optimized for maximum signal combined with nearly horizon to horizon response. It is designed to intercept the small amounts of RF energy.
Figure 1: Block diagram of the ground station hardware
A Pentium-60MHz computer equipped with decoder card and running on Windows95 platform is used. In order to run Timestep software under Window95 platform to do multitasking, the display adapter of the computer must support the direct-draw overlay. In this case, S3 Trio 64V+ display adapter is used in ht computer. After switching on the Timestep receiver, it starts scanning. The receiver will stop scanning when it detects the satellite signal. The speaker will indicates this by the sound 'tic-tic' .
ii. Management Software.
Basically, the UKM ground station is using two management programmes ( Quiktrak© and Mega NOAA© ) supplied by Timestep. Quiktrak is a satellite-tracking program, which located the position of the satellite in orbit. The software need to be configured before tracking the satellite with the Keplerian data, longitude, latitude and height above sea level for the city and ground station location ( QTH). Keplerian data contain the information about the satellite that we want the track such as name, satellite ID, inclination, mean motion, eccentricity and etc. they are available form a number of sources including ASR, AMSAT News Bulletins on PBBS, AMSAT Nets and others. NASA supplies tow line compact notation elements as well. The main menu of the program contains several functions and the most important function which are used in this case are as follow.
Schedule - after this selection is made the program proceeds to print out to the screen in tabular form a schedlr of ht passes ( apparitions ) over the location given by the latitude longitude height set of numbers entered in QTH or city information above. Table 1 shows and example of the schedule. The Acquisition of signal ( AOS) EPOCH is the data time of the beginning of the pass of the selected satellite. Loss of Signal ( LOS) EPOCH is the data and time of the end of the pass of he selected satellite. MAX is the time of maximum communications range. AZ is the azimuth of the satellite at the time of the maximum communications range. DX/EL is the elevation of the satellite in degrees at the time of the maximum communication range. The maximum communication range will then occur at either AOS or LOS depending on which is closer to an apogee.
| DATE | AOS hh:mm:ss |
MAX hh:mm:ss |
LOS EPOCH hh:mm:ss |
DX/EL | AZ | ORBIT |
| 06AUG97 | 181903 | 182509 | 183115 | 13 | 102 | 13418 |
| 06 AUG97 | 195805 | 200539 | 201313 | 41 | 282 | 14419 |
| 07 AUG97 | 070321 | 071104 | 071847 | 50 | 76 | 13425 |
| 07 AUG97 | 084535 | 085124 | 085713 | 11 | 257 | 13426 |
| 07 AUG97 | 180747 | 181310 | 181832 | 8 | 102 | 13432 |
| 07 AUG97 | 194556 | 195338 | 200120 | 58 | 281 | 13433 |
| 08 AUG97 | 065129 | 065858 | 070628 | 36 | 77 | 13439 |
| 08 AUG97 | 083253 | 083921 | 084550 | 15 | 257 | 13440 |
| 08 AUG97 | 175643 | 180104 | 180526 | 5 | 103 | 13446 |
| 08 AUG97 | 193343 | 194130 | 194916 | 81 | 276 | 13447 |
| 08 AUG97 | 211830 | 212133 | 212436 | 2 | 286 | 13448 |
| 09 AUG97 | 063936 | 164649 | 065401 | 26 | 76 | 13453 |
| 09 AUG97 | 082011 | 082711 | 083410 | 22 | 258 | 13454 |
Real Time 1 Sat - this function is for real-time tracking of the satellite. It has either graphic and text modes of operation. Fig. 2 shows an example of the graphic mode.
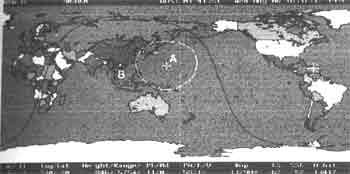
Figure 2: Real Time tracking satellite NOAA 14 for ground station 9MUKM from epoch 6th Aug97 16:37:12 GMT
(the satellite position is in indicated by A and the ground station in UKM is indicated by B)
Mega NOAA is a program for all LEOs . it will automatically synchronize to an image and store the complete image. when the image is being received it is displayed in completer but-low resolution format on the screen. This is to allow the whole image for 15 minutes to be shown. It starts to receive the satellite image after the Timestep pro-scan receiver has detected the satellite and indicates with the sound 'tic-tic".
NOAA Image Format [4]
The advanced very High Resolution Radiometer ( AVHRR) provides data for real time transmission to the NOAA local read-out services, termed High Resolution Picture Transmission ( HRPT). The primary objective is to provide visible, near infrared and thermal infrared spectral radiation bands. The AVHRR is a cross-track scanning system similar to the VHRR, but features four or five spectral channels, compared to just two for the VHRR NOAA-12 and NOAA-14 which is currently on orbit has five channels.
The multi-spectral radimeter of the operational NOAA satellite rotates at two revolutions per second or 120 revolutions per minute . One line of composite image data is transmitted with each revolution of the radiometer, so the basic line rate for these satellites is two lines per second. Each second represents 1000 millisecond ( ms ) and the basic line of NOAA data are 500 ms long . each 500 ms line of image data is made up of two different types of image data Infra-red information for the first 250ms and visible-light data for the second 250ms. There are a number of other distinctive elements to each line. The signal portion that represents the actual image is assumed to be an 8 -step grapy scale, running from black at the left to white on the right. Fig. 3. shows the video format for NOAA satellite. Each IR line begins with seven cycles during which the sub-carrier level swings form white to black and black to white. These seven transitions occur at the rat of 832 Hz. The r4ain of pulses appears as a fine seies of vertical black- and white bars in te sync pulse and can be shown on the display. IR line-sync pulse produces very distinctive 'tic-tic ' sound signal when it has reached full quienting in the station receiver. The visible-light segment immediately follows the IR line sequence. It begins with a seven -pulse sync sequence. These pulses occur at a 1040Hz rate and create a sequence of vertical black-and-white stripes down the leaf edge of the image. these stripes appear slightly narrower than their IR equivalent
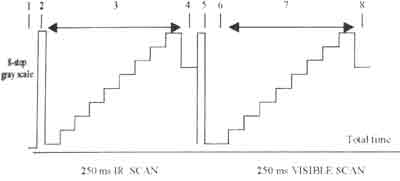
Figure 3: Video formats for NOAA satellite
WWW server Installation
The WWW server is to display the satellite on-line through the UKM campus wide ATM network [5]. Users can log on to the UKM ATM network to view the weather information through the internet on-line. In this study, a pentum-60MHz personal computer connected to a timestep Pro-scan set -up as he weather satellite's data control station. The computer is connected to the UKM campus ATM network as one of the WWW server. Website© is the shareware which was used to set up the computer as a server. It is from O'Reilly & Associates, Inc, and run Windows95 platform[6].
The IP address for the server (202. 185.44.195), the documents mapping, documents URL ( Uniform Resource Locator ) path and CGI ( Common Gateways Interface ) URL path have to be configured properly. In this case, we used the default setting where the default URL path is located in the 'htdocs' directory and the windows CGI path is in the 'cgi-shl' directory. All the CGI scripts for this case is put in the 'cgi-shl' directory whereby the other documents and homepage files are all located in ht e' htdocs' directory. Since we are using the server-side-include features form the software, all the homepage files are named with extension of html-ssi instead of normal htm or html extension.
After sensing up the WWW server, the PERL 5 is installed in the server in order to let the server understand the CGI is an interface to the Web server that enables us to extend the server's functionality [7]. Using CGI, we can extend the capability of our server to parse ( interpret ) input from the browser and return information based on user input. In this case, since we need to process the input from user through the homepage so CGI is required. All the CGI scripts in this study is written by PERL language. PERL is an interpreted language optimized for scanning arbitrary text files, extracting information from those text files, and printing reports based on that information [8] PERL5 is installed in the server in this study.
Initially, the satellite images is received images is received by using the satellite management software, MEGA NOAA program which running in the server. This program will save the particular image file in the satellite database in the seam computer. Program like Painshop Pro 4.12© is used to covert the image file in the GIF format to display through the browser. The file name is defined according to the CGI programming on the scripts, for example,' 1997002. gif ' is 2nd Jan of 1997. homepages are written to enables users to access the server. With CGI scripts, the homepages re able to process the sure requirements and output the information required by user . the satellite image will be display according to the year, month, day and type of display mode, either IR, visible-light or both of them . the CGI script will search the database and define the related image file to display to the user. If the file is unavailable in the database, the script will return an error file to the user and ask the user to enter the requirements again. A CGI script has been written also to check the data base for the latest image file and display it on the homepage to the user. Thus, all the satellite images, whether the past or latest, will be view on line by all the users log on to this server in the UKM ATM network through internet. Fig. 4 shows an example of the homepage output.
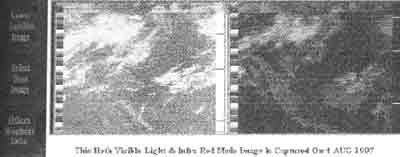
Figure 4: The homepage output of the visible-light and infra-red mode satellite image which was captured on 4th Aug. 1997
Conclusion
The weather images received from the satellite have been successfully display on-line through the UKM campus ATM network . Beside receiving the satellite signals, the server also process the satellite data automatically with all the CGI scripts which enable all the internet or intranet users to view the image through the homepage. All the satellite data is also stored in a satellite database for further research and analysis. Further development on the interfacing program between the ground station hardware and the computer should be done in order to capture the real-time satellite image. to improve the capability and speed of the server, it should be move to windows NT or UNIX platform. Hopefully, this achievement will be the beginning of the meteorology study in UKM.
Reference:
- NOAA Headquarter Homepage( http://www.noaa.gov ).
- NOAA satellite information service ( NOAASIS ). (http://140.90.207.25 )
- Saad A.Talhah, " Investigation of VHF Signals from Low Earth Orbits NOAA weather Satellite', M.Sc. Thesis, Universiti Kebangsaan Malaysia, 1996, pp. 36-60.
- NOAA Satellite Instrument ( http://saars.saa.noaa.gov: 8400/instrument documents /avhrr-sensor.html).
- Kasmiran jumari , " ATM campus Network Design - A case Study", ATM Workshop-ATM Application toward 2000, Asia-Pacific Market Awarness Committee ( APMAC) and UPM, April 21-22 , 1997.
- O' Reilly & Associates, Inc Homepage. ( http://www.ora.com.)
- Eugene Reic Kim, " CGI Developer's guide", Sams .net, 1996.
- Perl Language Homepage. ( http://www.perl.com).
The authors wish to thank ir associate Professor Dr. A.F.Mohd Zain and Mr. Saad A. Talhah for their contribution to set-up the ground station